
Welcome to Part I of a three-part series in which I’ll share an improved method of determining standings gain points factors. In this first part I’ll show graphically demonstrate the old method I used in calculating SGP factors and compare it to the improved method.
I’m mostly self-taught when it comes to my knowledge of standings gain points. It’s hard to say where I picked up the information. I think it’s an accumulation of information gleaned from message boards and old web sites. Nevertheless, I continue to learn and I recently came across an improved method of calculating SGP factors.
Enter Art McGee
Art McGee published his approach to using standings gain points in his book, How to Value Players for Rotisserie Baseball. The book was originally published in 1997 and he put out an updated version in 2007. So his theories have been around for quite some time and continue to live on. The Excel implementation of SGPs that I use has been tweaked some, but is very consistent with McGee’s approach.
NOTE: I have provided an affiliate link (what’s an affiliate link?) to the book on Amazon to the right, but at the time of writing, I don’t suggest you buy it from Amazon. It seems like the book is difficult to come by and the prices are quite high. The link is just so you can see the book and read the summary, or maybe the prices will come down in the future. If you do want to purchase McGee’s book, Baseball HQ is selling them on a close out sale for $8.95 plus S&H. That’s where I got my copy.
A Difference Is Found
Not too far into McGee’s explanation did I come across an important difference in the way he calculates his SGP factors. To illustrate the difference, let’s take a look the following sets of Home Run standings:
| Rotisserie Points | HR Data Set #1 | HR Data Set #2 |
|---|---|---|
| 12 | 291 | 300 |
| 11 | 287 | 273 |
| 10 | 281 | 260 |
| 9 | 274 | 249 |
| 8 | 272 | 249 |
| 7 | 267 | 248 |
| 6 | 263 | 243 |
| 5 | 261 | 241 |
| 4 | 244 | 231 |
| 3 | 239 | 231 |
| 2 | 234 | 229 |
| 1 | 191 | 203 |
I previously would have calculated my SGP factor for “HR Data Set #1” as the first place value (291) less the last place value (191), divided by the number of teams that could be passed (in a 12-team league you pass 11 teams by going from worst to first). Specifically the SGP for Data Set #1 is 9.0909 ((291-191)/11) and for Data Set #2 is 8.8182 ((300-203)/11).
Let’s Plot It Out
The red line below plots out the approach I have been using to calculate my SGP factors. If you think back to high school math class, we’re really calculating the slope of the line here. Notice how the 9.0909 I calculated above matches the slope in the formula representing the red line, y = 9.0909x + 181.91.
And when you look at the red line next to the other plotted data points, you see that it doesn’t do a great job of fitting data as a whole. This is the weakness in only using the highest and lowest data points to approximate the number of home runs necessary to move up one point in the standings.
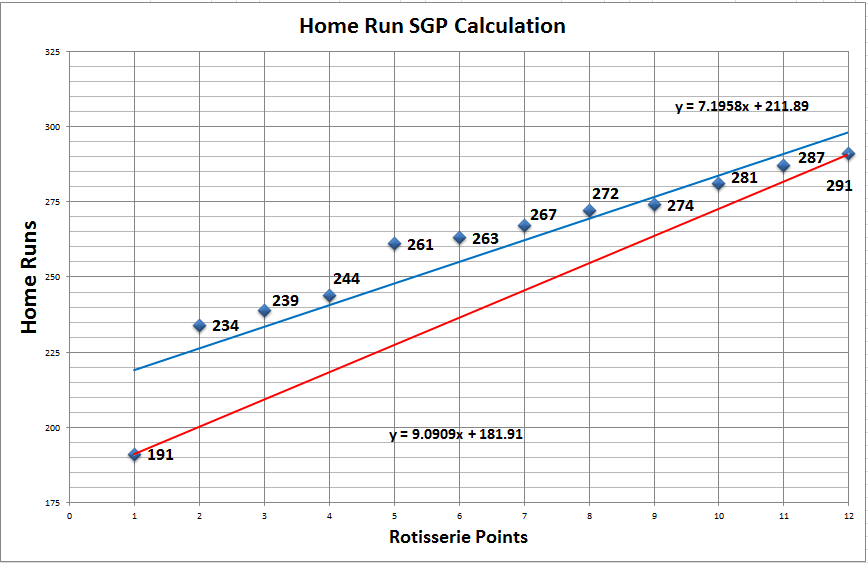
The approach McGee suggests is to use the SLOPE function in Excel. This function will calculate a line of best fit based upon all 12 of the data points. You can see that result as represented by the blue line in the chart above. I’ll show you how to utilize the Excel formula in Part II of this series, but for now you just need to know that it returns 7.1958. That’s quite a bit different from the 9.0909.
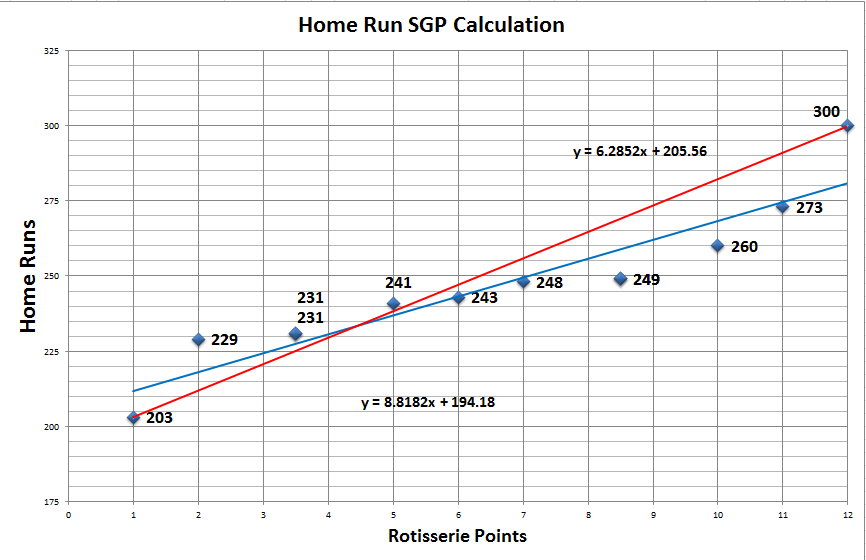
Looking At Data Set 2
Let’s look at a different set of standings data points. Like above, the red line represents the old method of only utilizing the first place team and the last place team to fit the data. And just like the first example, it leads to slightly skewed results.
The blue line below is calculated with the SLOPE function in Excel and does a much better job of taking all data points into account.
aNOTHER bENEFIT
Besides a more accurate fit to all the data points, the SLOPE function also mitigates another problem that I’ve always wrestled with… What to do with outlier teams that either tank the season or blow everyone out of the water? I feel much more comfortable leaving the outliers in my calculations because the SLOPE function will only give so much credence to those special circumstances.
What’s Coming?
In the second part of the series I’ll demonstrate how to perform these calculations in Microsoft Excel, and in the third part of the series I’ll take a closer look at how these changes affect our end rankings.
Want More In-Depth Analysis Like This?
Thanks For Reading
Stay smart.


What if my rotisserie league has different point values for each category? For example, I’m trying to apply your wonderful method to my rotisserie hockey pool using the same principles you’ve outlined in all the great guides. My Rotisserie league has 12 team,s but most categories are worth 0.75pts which means 1st place gets 9 points and 12th place gets 0.75. Other categories get up to 1.75pts (1st place = 21 and 12th place = 1.75). How do I account for this using the slope formula? Do I still let the x-values be equal to 1-12 or should I “weight” the x-values based on their roto point contribution?
Thanks for posting all this great information. Very helpful.
Hi Alex. You’re welcome, thanks for hanging around the site. That sounds like an interesting rotisserie wrinkle. I think I played fantasy hockey once years ago and it was a H2H deal, not rotisserie. Is that .75/1.75 point system something that’s unique to your league?
I played around with the data from the first table above. The slope formula I got above when I plotted things using 1, 2, 3, 4, etc was 7.1958x+211.89.
When I plot the same number of home runs against a scale of 0.75, 1.5, 2.25, etc. I get 9.5944x+211.89.
And 9.5944 / 7.1958 = 1.33333333. Which I think would be your factor if you were going to weight things afterwards (1/0.75 = 1.333333).
So it looks like you would get to the same result if you plot against the 0.75/1.75 or if you plot against the 1.00 scale and weight it afterwards.
In the end I think you just want to double check yourself and make sure you’re answering the question, “How many HR (or goals or assists) does it take to get one more point in the standings?”. In a world where 12 roto points go to first place it would have taken 7.1958 HR to get one more point. In a world where only 9 roto points go to first place, it would have taken 9.59 HR to get one more point (it’s harder to get 1 point in the 0.75 scale).
Thanks for the reply. I think I’m going to use places 1-12 with NO weighting to determine the slope since I think this better estimates how many goals (for example) you need to score to move up a place in the Goals standings.
Then when I use this slope in the SGP calc, I will then multiply the SGP for each category by their roto points weighting (1.75, 1.25, 0.75 etc) and then sum them up to get the total SGP. I think this makes the most sense.
Two questions:
1)Does that make sense to you?
2) Do you often see that the highest ranked players are usually well over-valued relative to your SGP calculations?
Thanks again for the help.
I don’t think it matters if you figure out the slope with the 1-12 or the 0.75-9 as long as you multiply by the weights at the end (when using 1-12).
I’m not familiar with hockey’s player pool to know if that makes sense, but for baseball going into this 2014 season I had Mike Trout and Miguel Cabrera valued at $46-$47 and the next closest player valued at $36, so it’s entirely possible (or about 8 SGP over replacement level vs. about 6 SGP for the next closest players).