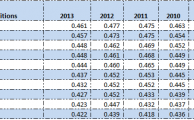
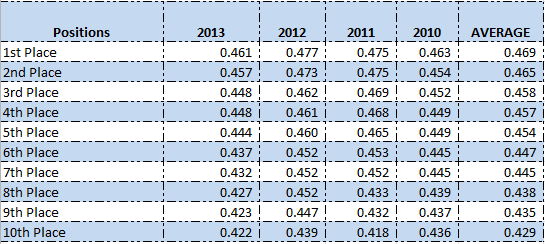
Again, special thanks are in order for reader Matt who also filled out the “What It Takes To Win Your League Calculator” with the last four years of history for the SLG category in his league. You can see the data for ten teams listed below.
How Many SLG Percentage Points Move You Up One Spot In The Standings?
Over the last four years, an average of .469 won the category and an average of .429 finished 10th.
.469 – .429 = .040 total spread between 10 teams
We have the data for 10 teams, meaning there are 9 spots you can move up in the standings by moving from .429 to .469 in team SLG.
.040 / 9 = .00444
On average, increasing your team SLG by .00444 points will result in you climbing one spot in the standings.
But I Play In A 12-Team League, Can I Use This Figure?
If you have an established league history with historic standings available to you, you can always calculate this yourself based upon your league’s specific history.
I don’t have specific evidence to support this, but I would venture a guess that limiting your SGP calculations to the top 10 out of 12 teams might be more beneficial than using all 12 teams. This would minimize or eliminate the effect of teams that lose competitiveness or that tank the season.
What Formula Do I Use To Calculate The SGP For A Given Player?
Recall from Part 5 of the “Create Your Own Rankings” series, that you determine the SGP for a ratio stat, like SLG, by removing the effect an average player has on an average team, and then inserting the player you are ranking into the equation. (more…)
I frequently get asked how to calculate standings gain points for the OBP category. In this post I’ll give you an example of how to perform this calculation .
Full disclosure: I don’t play in any OBP leagues.
I know, I know. You just lost a ton of respect for me and you’re considering leaving the site. But I’m here to serve, so let’s figure this out together.
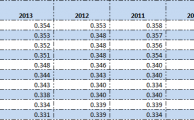
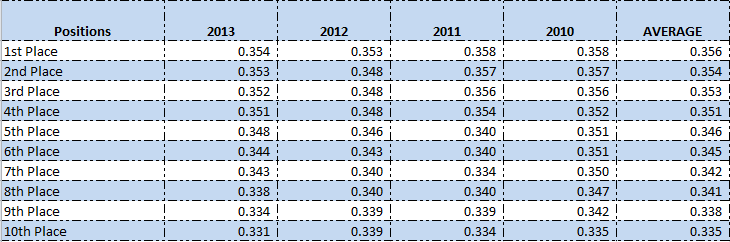
Before we begin, special thanks are in order for reader Matt who graciously agreed to fill out the “What It Takes To Win Your League Calculator” with the last four years of history for the OBP category in his league. You can see the data for ten teams listed below.
How Many OBP Points Move You Up One Spot In The Standings?
Over the last four years, an average of .356 won the category and an average of .335 finished 10th.
.356 – .335 = .021 total spread between 10 teams
We have the data for 10 teams, meaning there are 9 spots you can move up in the standings by moving from .335 to .356 in team OBP.
.021 / 9 = .00233
On average, increasing your team OBP by .0023 points will result in you climbing one spot in the standings.
But I Play In A 12-Team League, Can I Use This Figure?
If you have an established league history with historic standings available to you, you can always calculate this yourself based upon your league’s specific history.
I don’t have specific evidence to support this, but I would venture a guess that limiting your SGP calculations to the top 10 out of 12 teams might be more beneficial than using all 12 teams. This would minimize or eliminate the effect of teams that lose competitiveness or that tank the season.
What Formula Do I Use To Calculate The SGP For A Given Player?
Recall from Part 5 of the “Create Your Own Rankings” series, that you determine the SGP for a ratio stat, like OBP, by removing the effect an average player has on an average team, and then inserting the player you are ranking into the equation. (more…)
In this post I’ll show you how you can take a boring black and white spreadsheet and convert it into a visually meaningful piece of art in less than 10 minutes.
An important factor in being a skilled drafter is the ability to remain cool and calm in pressure situations. There may also be opportunities to intimidate some of your opponents during the draft, to give them the impression that you are highly prepared and ultimately familiar with the player pool and your own drafting strategy.
Nothing can accomplish these things better than a fancy color-coded spreadsheet.
There may be an element of hyperbole in that statement. But we have all been there. It’s late in the draft, you’ve already wasted 60 of your 90 second allotted time and you’ve just made the decision that you need to draft a second basemen with some power but that won’t kill you in batting average. Or you need a pitcher with good strikeout totals that won’t kill you in WHIP. Or some obscure shortstop is thrown out for bid in the auction and you can’t remember if he will help you with reaching your target goal in stolen bases.
Enter Conditional Formatting in Excel
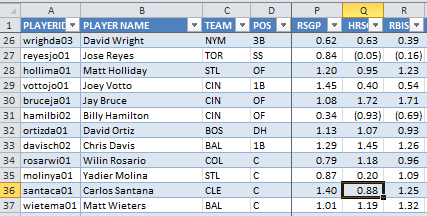
Conditional Formatting in Excel allows you to give visual meaning to a mass of boring looking numbers that can be hard to interpret all at once. Let’s face it, while looking at the spreadsheet example in the image below it is not easy to quickly make sense of the numbers.
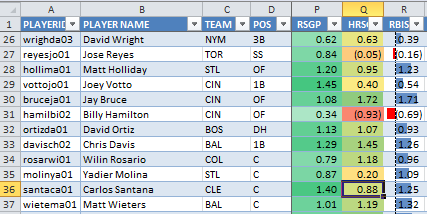
But if I take this same area and apply a few of the different conditional formatting rules to it, you can much more quickly make sense of what you are seeing:
In the “RSGP” column I have applied a rule in which you select two colors. One color represents the highest value in the data selected and the other color represents the lowest value in the data selected. I chose a standard green color for the highest value and white for the lowest. Excel then automatically provides shades between white and green to each player’s “RSGP” based upon its value relative to all the other players in the list. Whether you agree with me or not, I’m down on Billy Hamilton’s ability to stick at lead off for the entire year, and his run projection is the lowest of anyone captured in the screenshot. So he’s the closest to white. While Votto has the highest “RSGP” in this small group of players, so he’s shaded closest to green.
The “HRSGP” column has a rule using three colors. Green is still used for the values that are greatest in this column. Red is used for the lowest values, And Yellow is used for values near the 50th percentile of the group. Again, Excel automatically shades ever player’s value according to this set of instructions. You simply select the three colors and Excel does the rest. Here you can see Billy Hamilton is projected to be very low in “HRSGP”, while Jay Bruce and Chris Davis are much higher. These two illustrate an important concept too. I have Bruce projected to hit fewer home runs than Chris Davis, but Bruce comes out with a higher “HRSGP” based upon the positional replacement level adjustment under the SGP method.
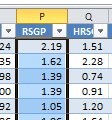
The “RBISGP” is using data bars to depict the value of each player’s RBI compared to the group. Not to keep piling on Billy Hamilton’s lack of hitting prowess, but you see he has a red bar pointing to the left, in his “RBISGP” column. This indicates the magnitude to which his RBI projections are below 0.00 SGP. Jay Bruce, right above him, has a very strong RBI projection and a blue shaded bar depicts this.
This Seems Way Too Complicated
It’s really not. You can add this to your draft spreadsheet in under 10 minutes.
Things To Consider Before We Start
In the step-by-step instructions below, I apply conditional formatting to a player’s standings gain point (SGP) figure for each individual category (e.g. HR, BA, R, etc). I choose to do this because after following the “Create Your Own Fantasy Baseball Rankings” approach, the final SGP figure for any player includes an adjustment for replacement level at the position. This means that 15 HR from a 2B are valued more than 15 HR from a 1B.
The other benefit of applying the formatting to the SGP columns is that rate states like BA, ERA, and WHIP will be weighted appropriately. An OF that might hit .300 but only get 200 PAs isn’t really helpful to our team BA.
There is an argument to be made that you would want to apply conditional formatting to a player’s raw statistics instead of the SGP figure. After all, if you’re trying to draft players in order to reach a targeted goal (like 250 HR), you might be more interested in a 1B projected to hit 18 than the C projected for 17, even though those 17 from the C are more “valuable”.
Anyways, that’s beyond the scope of this post. I’m just here to add fancy colors to your spreadsheet right now. Just know that you can do this using a player’s raw projections even if you haven’t worked through the “Create Your Own Fantasy Baseball Rankings” series.
WARNING: This post was originally made prior to the 2014 MLB season. The Projecting X Spreadsheet Template has since been improved! For more information, please go to smartfantasybaseball.com/bundle.
If you’re looking for a project that will prepare you for the upcoming season and teach you how to create your own fantasy baseball projections, look no further.
I’ve created two videos that demonstrate Mike Podhorzer’s “Projecting X” and the additional materials I have created to go along with it.
First, some practical examples of how easy it is to update your own formula-driven Excel projections:
Second, a close up look of all that is included in “the bundle”:
Like what you see? Interested in supporting this site? Please click here.
This topic came up recently and a number of well-respected fantasy experts discussed and debated the topic. I’m not here to rehash what they said, but hopefully to offer some points I didn’t see made in the discussions.
If you want to catch up on exactly what has previously been said:
I believe Sarris got the idea for the post from a Twitter conversation between Steve Gardner (USA Today Fantasy Sports), Christopher Liss (Rotowire), Mike Gianella (Baseball Prospectus Fantasy), and Jeff Erickson (Rotowire). You can see that conversation at this link (scroll up and down to see full conversation).
Before Twitter, we didn’t have this kind of access into theoretical discussions about fantasy baseball. It’s great to see this kind of back-and-forth and hashing out of ideas from a knowledgeable and respected group of fantasy writers. So what can I offer to this?
Cherry Picking
I will pull two specific tweets out of the discussion. Let’s start with this one from Kreutzer:
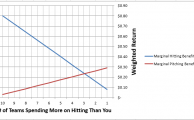
A lot of explanations were thrown out to explain the popular 70-30 hitter allocation, but I think this makes the most sense. Kreutzer gives very specific figures in Part 1 of his explanation of this topic, and specifically mentions that the average return on investment for all hitters in expert leagues was 88% (or a loss of 12%). For pitchers the return was 32% (or a loss of 68%). Keep this in mind. We’ll come back to these figures later.
In Part 2 he discusses the concept of “free loot”, or valuable fantasy stats that were not drafted but find their way onto rosters in your league during the year.
Alright, I’m starting to understand the reason for hitters to be allocated more money. Why try to buy pitching stats during the draft if value from pitchers is difficult to predict accurately and if I can just wait until the season starts to pick up valuable players on from the free agent pool anyways.
Justin Timberlake has come a long way. He started out as a dorky little kid on the Mickey Mouse Club, “progressed” (notice the strategic use of quotation marks) to this, started dating the hottest celebrities (at the time), began appearing in award winning movies, and now he’s winning solo recording artist honors.
This example of Timberlake was mentioned by Marc Ecko, the billion-dollar fashion mogul, in a podcast interview about what it takes to be great (click here to listen). He used this illustration of Timberlake to point out that nobody ever really starts out great. It’s a process. To paraphrase what Ecko said:
Iteration is the act of repeating a process with the aim of approaching a desired goal, target or result.
Said another way, it’s about making continuous improvement over time. Small improvements. But a lot of them. Not necessarily dramatic leaps forward.
Timberlake didn’t just snap his fingers and go from scrawny Mickey Mouse Club kid to Music-Superstar-Hollywood-Actor-Junk-In-A-Box-Heartthrob. It took him years to get there.
Every season. Small incremental improvements. For many seasons.
If you start applying this concept now and master a couple new fantasy baseball concepts each year, think how good you will be five or even ten years from now.
Are You Improving?
One reason I enjoy having this site is that it holds me accountable to improve at this “craft” of playing fake baseball games.
I have had seasons in the past where I didn’t seek to improve knowledge or understanding of the game. But now I have reached a point where I try something new every year.
I make my draft preparation a little more involved. I add new features to my spreadsheet. I enhance my rankings formula. I consider other ways of ranking players. I just developed my own projections for the first time. I read books about (real) baseball, Sabermetrics, technology, and even fantasy baseball.
So What Are You Doing To Improve This Year?
There are many things you can do. Here are some things that come to mind (more…)
I’ll paraphrase a reader question I recently received:
Hey, you with your big fancy spreadsheets. I need a way to easily hide the players that have already been drafted so I don’t waste time digging around in a bunch of players that are no longer available. Have any tips?
– Bill
Great question. Let me show you how I do this.
But First…
We have three key Excel concepts or features you should understand. If you’re already familiar with these, just skip down to the step-by-step instructions below.
Named Ranges
Data Validation
Filtering
Named Ranges
Excel allows you to create names for groups or blocks of cells. Once established you can use this name in formulas instead of having to fully spell out the entire range of data again. I find it a lot easier to deal with a name like “TeamNames” than it is to explicitly specify the area of a range like “Settings!$A$1:$A$10”. Named ranges are a lot easier to remember and a lot less likely to result in errors.
Data Validation
Data validation ensures that information entered in a cell or calculated by the Excel fits specified criteria. You could validate that information entered in the cell is a date or is larger than 0, for example.
In the example below we will create a drop down menu that lists each team in your fantasy league and validates that the selected value is spelled correctly and corresponds to a team in your league.
Filtering
Filtering is a function in Excel that allows you to hide entire rows of data that don’t meet certain requirements. In this example we will filter the list of players to hide players that have been given a team (they have been drafted).
Step-By-Step Instructions
The following instructions will take you through the process of adding a column to track which players have been drafted and which team in your league selected each player. We will create a drop down menu that lists all teams in your league and use this to document who was drafted and by what team.
These instructions assume you have some kind of a starting spreadsheet containing projections and rankings already. If you don’t have such a starting point, skip to the end of this post for information on how to get here. (more…)
I don’t like Alex Rios. I’m not sure if it’s because he used to go by the name Alexis. Or maybe I owned him in 2009 when he hit .247. Or maybe I bought into some hype telling me he would hit 30 HR in a given season and he stuck me with 17 instead.
Regardless. I might be coming around on Mr. Rios. Here’s why…
You’ve Got Mail
Remember when Meg Ryan was famous? Anyways, I recently got an e-mail from a reader wondering if he should keep Jose Bautista, Justin Upton, or Alex Rios.
When I see a question like this, my first reaction is to eliminate the low hanging fruit. So I wiped Rios out of the equation and started to think about Bautista and Upton.
Then I opened up my early 2014 projections:
Player
H-RANK
SGP
AVG
R
HR
RBI
SB
Rios
11
5.03
.280
78
18
81
33
Upton
39
3.53
.269
97
26
73
12
Bautista
60
2.70
.264
82
28
78
7
My Ranking Formulas Have To Be Wrong
My immediate reaction was that my ranking formulas had to be wrong. Rios couldn’t be so significantly better than Upton and Bautista. Or could he?
After all, Rios was the 9th ranked hitter on ESPN’s 2013 Player Rater (heck, he was 6th in 2012!). Upton was 48th. And Bautista was 59th. All of those rankings look incredibly in line with my preseason rankings. Maybe they are right.
If The Ranking Is Right, Then My Projections Have To Be Wrong
I’ve only done one pass through my projections as of the time of this post in early January 2014 (learn to make your own projections here). Maybe I need to take a closer look at Rios and downgrade some of those stats. Maybe I’m too favorable. My projections are exclusively based on a player’s last three seasons. So let’s take a look:
So my .280, 78R, 18 HR, 81 RBI doesn’t look unreasonable. If anything, the counting numbers of R and RBI might be low when you consider he played most of his games last season for the AL’s worst team offense (CHW) to now having a full season in an above average offense from last year that is arguably even better (TEX).
I started on this endeavor thinking I needed to bump down his projections (more on this later… this is a crappy way of thinking), and now I’m convinced he’ll probably score more R and have more RBI? Heading in the wrong direction here.
It All Comes Down To Stolen Bases
Rios gets the bulk of his value from stolen bases. So even if his R and RBI increase a touch, it’s not going to significantly affect things.
The key question to answer is can we really expect the 33 projected steals from a soon to be 33-year old aging outfielder?
I don’t want the point of this article to be exactly how I projected Rios’ SB totals, so I’m not going to go into great detail. But when you consider the following facts, 33 is not unreasonable:
TEX led MLB in stolen base attempts (195 TEX, 147 CHW)
TEX was second in stolen bases (149 TEX, 105 CHW)
TEX was seventh in SB% (76% TEX, 71% CHW)
Rios had 17 SBA in 47 games for TEX last season (roughly on pace for 51 SBA for a full season)
Rios has a SB% of 80% the last three seasons, a rate which would give him about 40 SB in 51 SBA
So even if he slows his pace and begins to get caught more, there is cushion in that projection of 33.
For Argument’s Sake, What If We Project 20 SB
If the rest of his stat line remains the same and the projection of 33 SB falls to 20, his ranking adjusts from the 11th best hitter to 36! He’s still ahead of Upton!
It’s Early, But Where Is Rios Being Drafted?
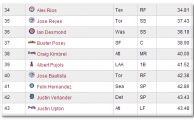
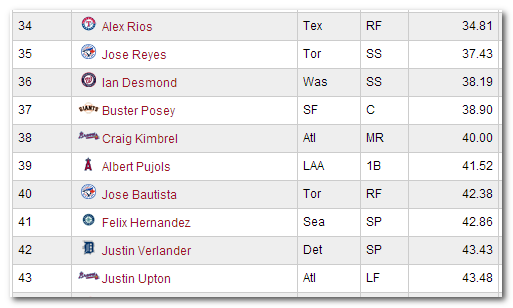
Rios is currently going 34th overall, with Bautista going 40th, and Upton going 43rd. I obviously have to familiarize myself more with this ADP information. I should not have dismissed Rios out of hand the way I did.
Alex Rios, Jose Bautista, and Justin Upton NFBC ADP as of January 11, 2014 courtesy of Stats.com
Let’s Learn From This
This whole exercise demonstrates two important lessons.
First, this is a perfect demonstration on how to find value by making your own rankings and projections. Remember, Rios came out as the 11th best hitter in my projections! He’s being drafted 34th overall!
This is not to say that you have to agree with my assessments of Rios. But if you go to a top 200 list at popular fantasy websites, you will probably see Rios ranked in the 30s or 40s. If you run your own projections and realize he comes out at 11, you have FANTASY GOLD on your hands. You can take a player in the 3rd or 4th round that you think will return 1st round value! I hate to repeat myself, but this is exactly why you need to be get your hands dirty and make your own rankings and projections.
Second, it was an awful mistake for me to look at my ranking and want to search for ways to downgrade Rios. I spent hours of time developing my own projections using proven methods and then running objective mathematical formulas to calculate each player’s value from those projections. The ranking is what it is. The projected stats are what they are. And they are calculating a very strong ranking.
It’s not wrong to double-check and possibly adjust your projections. But that’s not really what I tried to do. I don’t like Rios. I know this. I was purposefully considering a decrease in his projected stats just so he would fall in the rankings to where I thought he “should be”. That’s a mistake.
Just because he comes out ranked 11th doesn’t mean I need to draft him 11th. That’s the value of good ADP information and planning your draft out ahead of time (knowing you might be able to wait until the 3rd round).
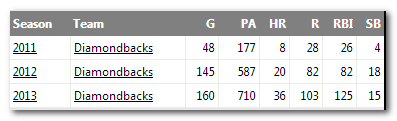
Envision a Major League Baseball player’s stat line. If you’re having trouble doing that, here’s one:
Paul Goldschmidt’s recent MLB stat lines, courtesy of Fangraphs.com.
Those are Paul Goldschmidt’s Major League statistics for the last three seasons.
How Do We Take That Information And Create 2014 Projections?
Do we just eyeball it and say, “He hit 20 HR in 2012 and 36 in 2013, so I’ll project 28.”? Do we give more weight to 2013, because it’s the most recent season? Is Goldschmidt still improving? Could he hit more than 36?
What about stolen bases? Or batting average? Runs? RBI?
There are a lot of moving parts here. And they’re all somewhat related to each other. How do you make sense of all this information and develop a sound, reliable, and accurate projection for what will happen in 2014?
We Have To Disaggregate the Data
“There you go again, Tanner. Using words like ‘disaggregate’. What does that even mean?”
An Example
Assume you own an ice cream cone stand and you’re trying to project what sales of ice cream will be this month. What factors would go into that calculation?
You could just project it at a very high level and say, “Sales were $10,000 last month and $9,000 the month before. So I will estimate $9,500 for the current month”. And that might give you a reasonably close estimate.
But the key to accurate projections is to look at underlying data or events that make up that end result. You want to break apart the big event, or disaggregate it into smaller events you can study and measure. Instead of trying to guess the ending sales result, you’re better off trying to project the smaller things that make up that monthly total:
The average selling price per ice cream cone
The number of ice cream cones sold
How many hours is the stand open each day?
How many people will walk by the ice cream stand in a day? In an hour?
Out of every 100 people that walk by the stand, how many buy a cone?
After you have estimated this information, you run the math and calculate the total sales for the month.
Why This Works
It’s hard to just look at $9,000 and $10,000 of monthly ice cream sales and make sense of those numbers. But if you know that you raised the price of each cone 25 cents, that you just hired an employee that will allow you to keep the stand open longer each day, that the employee has a striking resemblance to Jennifer Lawrence (with long hair, please) and has an uncanny ability to sell ice cream, and that there is a large festival taking place this month that will bring an extra 5,000 people by the stand, then you’ll be able to make a much more accurate projection than you would by simply looking at past monthly sales figures.
Applying This To Baseball
You can think of our typical rotisserie baseball categories as aggregated data, like the monthly ice cream sales. When you break it down a home run is actually the end result of many smaller outcomes that added up to the end result of a baseball being hit over the fence.
All of these events have to happen for a home run to occur:
The ball has to clear the fence, which means:
The ball has to travel X number of feet
The fence is < X from home plate
The ball has to be hit in the air (a fly ball)
The hitter has to have an at bat, which means:
The hitter has to have a plate appearance
The hitter has to make contact (no swing and miss)
The hitter has to swing
We could take this further, but you get the idea.
We Live In An Amazing Time
Fortunately, we have data available (for free!) to measure every bullet point above. Sticking with our original Goldschmidt example:
“The Process”, My Latest Book, with Jeff Zimmerman
The 2024 edition of The Process, by Jeff Zimmerman and Tanner Bell, is now available! Click here to read what folks like John Pausma, Phil Dussault, Eno Sarris, Clay Link, Rob Silver, Rudy Gamble, and others have to say about the book.
The Process is your one-stop resource for better drafting, in-season management, and developing strategies to become a better manager. The book is loaded with unique studies, tips, and strategies you won't find anywhere else. Click here for more details.