This topic came up recently and a number of well-respected fantasy experts discussed and debated the topic. I’m not here to rehash what they said, but hopefully to offer some points I didn’t see made in the discussions.
If you want to catch up on exactly what has previously been said:
I believe Sarris got the idea for the post from a Twitter conversation between Steve Gardner (USA Today Fantasy Sports), Christopher Liss (Rotowire), Mike Gianella (Baseball Prospectus Fantasy), and Jeff Erickson (Rotowire). You can see that conversation at this link (scroll up and down to see full conversation).
Before Twitter, we didn’t have this kind of access into theoretical discussions about fantasy baseball. It’s great to see this kind of back-and-forth and hashing out of ideas from a knowledgeable and respected group of fantasy writers. So what can I offer to this?
Cherry Picking
I will pull two specific tweets out of the discussion. Let’s start with this one from Kreutzer:
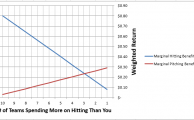
A lot of explanations were thrown out to explain the popular 70-30 hitter allocation, but I think this makes the most sense. Kreutzer gives very specific figures in Part 1 of his explanation of this topic, and specifically mentions that the average return on investment for all hitters in expert leagues was 88% (or a loss of 12%). For pitchers the return was 32% (or a loss of 68%). Keep this in mind. We’ll come back to these figures later.
In Part 2 he discusses the concept of “free loot”, or valuable fantasy stats that were not drafted but find their way onto rosters in your league during the year.
Alright, I’m starting to understand the reason for hitters to be allocated more money. Why try to buy pitching stats during the draft if value from pitchers is difficult to predict accurately and if I can just wait until the season starts to pick up valuable players on from the free agent pool anyways.
Justin Timberlake has come a long way. He started out as a dorky little kid on the Mickey Mouse Club, “progressed” (notice the strategic use of quotation marks) to this, started dating the hottest celebrities (at the time), began appearing in award winning movies, and now he’s winning solo recording artist honors.
This example of Timberlake was mentioned by Marc Ecko, the billion-dollar fashion mogul, in a podcast interview about what it takes to be great (click here to listen). He used this illustration of Timberlake to point out that nobody ever really starts out great. It’s a process. To paraphrase what Ecko said:
Iteration is the act of repeating a process with the aim of approaching a desired goal, target or result.
Said another way, it’s about making continuous improvement over time. Small improvements. But a lot of them. Not necessarily dramatic leaps forward.
Timberlake didn’t just snap his fingers and go from scrawny Mickey Mouse Club kid to Music-Superstar-Hollywood-Actor-Junk-In-A-Box-Heartthrob. It took him years to get there.
Every season. Small incremental improvements. For many seasons.
If you start applying this concept now and master a couple new fantasy baseball concepts each year, think how good you will be five or even ten years from now.
Are You Improving?
One reason I enjoy having this site is that it holds me accountable to improve at this “craft” of playing fake baseball games.
I have had seasons in the past where I didn’t seek to improve knowledge or understanding of the game. But now I have reached a point where I try something new every year.
I make my draft preparation a little more involved. I add new features to my spreadsheet. I enhance my rankings formula. I consider other ways of ranking players. I just developed my own projections for the first time. I read books about (real) baseball, Sabermetrics, technology, and even fantasy baseball.
So What Are You Doing To Improve This Year?
There are many things you can do. Here are some things that come to mind (more…)
I’ll paraphrase a reader question I recently received:
Hey, you with your big fancy spreadsheets. I need a way to easily hide the players that have already been drafted so I don’t waste time digging around in a bunch of players that are no longer available. Have any tips?
– Bill
Great question. Let me show you how I do this.
But First…
We have three key Excel concepts or features you should understand. If you’re already familiar with these, just skip down to the step-by-step instructions below.
Named Ranges
Data Validation
Filtering
Named Ranges
Excel allows you to create names for groups or blocks of cells. Once established you can use this name in formulas instead of having to fully spell out the entire range of data again. I find it a lot easier to deal with a name like “TeamNames” than it is to explicitly specify the area of a range like “Settings!$A$1:$A$10”. Named ranges are a lot easier to remember and a lot less likely to result in errors.
Data Validation
Data validation ensures that information entered in a cell or calculated by the Excel fits specified criteria. You could validate that information entered in the cell is a date or is larger than 0, for example.
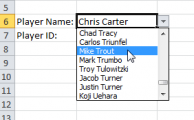
In the example below we will create a drop down menu that lists each team in your fantasy league and validates that the selected value is spelled correctly and corresponds to a team in your league.
Filtering
Filtering is a function in Excel that allows you to hide entire rows of data that don’t meet certain requirements. In this example we will filter the list of players to hide players that have been given a team (they have been drafted).
Step-By-Step Instructions
The following instructions will take you through the process of adding a column to track which players have been drafted and which team in your league selected each player. We will create a drop down menu that lists all teams in your league and use this to document who was drafted and by what team.
These instructions assume you have some kind of a starting spreadsheet containing projections and rankings already. If you don’t have such a starting point, skip to the end of this post for information on how to get here. (more…)
I don’t like Alex Rios. I’m not sure if it’s because he used to go by the name Alexis. Or maybe I owned him in 2009 when he hit .247. Or maybe I bought into some hype telling me he would hit 30 HR in a given season and he stuck me with 17 instead.
Regardless. I might be coming around on Mr. Rios. Here’s why…
You’ve Got Mail
Remember when Meg Ryan was famous? Anyways, I recently got an e-mail from a reader wondering if he should keep Jose Bautista, Justin Upton, or Alex Rios.
When I see a question like this, my first reaction is to eliminate the low hanging fruit. So I wiped Rios out of the equation and started to think about Bautista and Upton.
Then I opened up my early 2014 projections:
Player
H-RANK
SGP
AVG
R
HR
RBI
SB
Rios
11
5.03
.280
78
18
81
33
Upton
39
3.53
.269
97
26
73
12
Bautista
60
2.70
.264
82
28
78
7
My Ranking Formulas Have To Be Wrong
My immediate reaction was that my ranking formulas had to be wrong. Rios couldn’t be so significantly better than Upton and Bautista. Or could he?
After all, Rios was the 9th ranked hitter on ESPN’s 2013 Player Rater (heck, he was 6th in 2012!). Upton was 48th. And Bautista was 59th. All of those rankings look incredibly in line with my preseason rankings. Maybe they are right.
If The Ranking Is Right, Then My Projections Have To Be Wrong
I’ve only done one pass through my projections as of the time of this post in early January 2014 (learn to make your own projections here). Maybe I need to take a closer look at Rios and downgrade some of those stats. Maybe I’m too favorable. My projections are exclusively based on a player’s last three seasons. So let’s take a look:
So my .280, 78R, 18 HR, 81 RBI doesn’t look unreasonable. If anything, the counting numbers of R and RBI might be low when you consider he played most of his games last season for the AL’s worst team offense (CHW) to now having a full season in an above average offense from last year that is arguably even better (TEX).
I started on this endeavor thinking I needed to bump down his projections (more on this later… this is a crappy way of thinking), and now I’m convinced he’ll probably score more R and have more RBI? Heading in the wrong direction here.
It All Comes Down To Stolen Bases
Rios gets the bulk of his value from stolen bases. So even if his R and RBI increase a touch, it’s not going to significantly affect things.
The key question to answer is can we really expect the 33 projected steals from a soon to be 33-year old aging outfielder?
I don’t want the point of this article to be exactly how I projected Rios’ SB totals, so I’m not going to go into great detail. But when you consider the following facts, 33 is not unreasonable:
TEX led MLB in stolen base attempts (195 TEX, 147 CHW)
TEX was second in stolen bases (149 TEX, 105 CHW)
TEX was seventh in SB% (76% TEX, 71% CHW)
Rios had 17 SBA in 47 games for TEX last season (roughly on pace for 51 SBA for a full season)
Rios has a SB% of 80% the last three seasons, a rate which would give him about 40 SB in 51 SBA
So even if he slows his pace and begins to get caught more, there is cushion in that projection of 33.
For Argument’s Sake, What If We Project 20 SB
If the rest of his stat line remains the same and the projection of 33 SB falls to 20, his ranking adjusts from the 11th best hitter to 36! He’s still ahead of Upton!
It’s Early, But Where Is Rios Being Drafted?
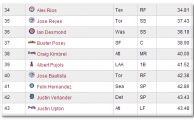
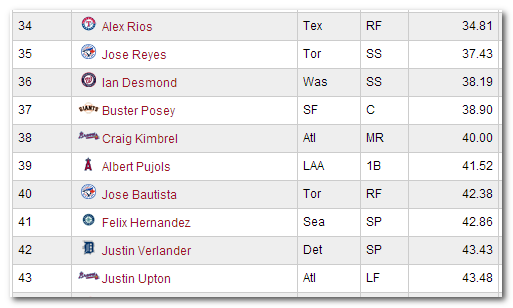
Rios is currently going 34th overall, with Bautista going 40th, and Upton going 43rd. I obviously have to familiarize myself more with this ADP information. I should not have dismissed Rios out of hand the way I did.
Alex Rios, Jose Bautista, and Justin Upton NFBC ADP as of January 11, 2014 courtesy of Stats.com
Let’s Learn From This
This whole exercise demonstrates two important lessons.
First, this is a perfect demonstration on how to find value by making your own rankings and projections. Remember, Rios came out as the 11th best hitter in my projections! He’s being drafted 34th overall!
This is not to say that you have to agree with my assessments of Rios. But if you go to a top 200 list at popular fantasy websites, you will probably see Rios ranked in the 30s or 40s. If you run your own projections and realize he comes out at 11, you have FANTASY GOLD on your hands. You can take a player in the 3rd or 4th round that you think will return 1st round value! I hate to repeat myself, but this is exactly why you need to be get your hands dirty and make your own rankings and projections.
Second, it was an awful mistake for me to look at my ranking and want to search for ways to downgrade Rios. I spent hours of time developing my own projections using proven methods and then running objective mathematical formulas to calculate each player’s value from those projections. The ranking is what it is. The projected stats are what they are. And they are calculating a very strong ranking.
It’s not wrong to double-check and possibly adjust your projections. But that’s not really what I tried to do. I don’t like Rios. I know this. I was purposefully considering a decrease in his projected stats just so he would fall in the rankings to where I thought he “should be”. That’s a mistake.
Just because he comes out ranked 11th doesn’t mean I need to draft him 11th. That’s the value of good ADP information and planning your draft out ahead of time (knowing you might be able to wait until the 3rd round).
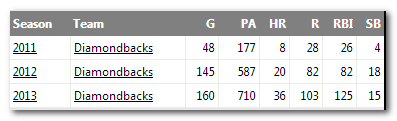
Envision a Major League Baseball player’s stat line. If you’re having trouble doing that, here’s one:
Paul Goldschmidt’s recent MLB stat lines, courtesy of Fangraphs.com.
Those are Paul Goldschmidt’s Major League statistics for the last three seasons.
How Do We Take That Information And Create 2014 Projections?
Do we just eyeball it and say, “He hit 20 HR in 2012 and 36 in 2013, so I’ll project 28.”? Do we give more weight to 2013, because it’s the most recent season? Is Goldschmidt still improving? Could he hit more than 36?
What about stolen bases? Or batting average? Runs? RBI?
There are a lot of moving parts here. And they’re all somewhat related to each other. How do you make sense of all this information and develop a sound, reliable, and accurate projection for what will happen in 2014?
We Have To Disaggregate the Data
“There you go again, Tanner. Using words like ‘disaggregate’. What does that even mean?”
An Example
Assume you own an ice cream cone stand and you’re trying to project what sales of ice cream will be this month. What factors would go into that calculation?
You could just project it at a very high level and say, “Sales were $10,000 last month and $9,000 the month before. So I will estimate $9,500 for the current month”. And that might give you a reasonably close estimate.
But the key to accurate projections is to look at underlying data or events that make up that end result. You want to break apart the big event, or disaggregate it into smaller events you can study and measure. Instead of trying to guess the ending sales result, you’re better off trying to project the smaller things that make up that monthly total:
The average selling price per ice cream cone
The number of ice cream cones sold
How many hours is the stand open each day?
How many people will walk by the ice cream stand in a day? In an hour?
Out of every 100 people that walk by the stand, how many buy a cone?
After you have estimated this information, you run the math and calculate the total sales for the month.
Why This Works
It’s hard to just look at $9,000 and $10,000 of monthly ice cream sales and make sense of those numbers. But if you know that you raised the price of each cone 25 cents, that you just hired an employee that will allow you to keep the stand open longer each day, that the employee has a striking resemblance to Jennifer Lawrence (with long hair, please) and has an uncanny ability to sell ice cream, and that there is a large festival taking place this month that will bring an extra 5,000 people by the stand, then you’ll be able to make a much more accurate projection than you would by simply looking at past monthly sales figures.
Applying This To Baseball
You can think of our typical rotisserie baseball categories as aggregated data, like the monthly ice cream sales. When you break it down a home run is actually the end result of many smaller outcomes that added up to the end result of a baseball being hit over the fence.
All of these events have to happen for a home run to occur:
The ball has to clear the fence, which means:
The ball has to travel X number of feet
The fence is < X from home plate
The ball has to be hit in the air (a fly ball)
The hitter has to have an at bat, which means:
The hitter has to have a plate appearance
The hitter has to make contact (no swing and miss)
The hitter has to swing
We could take this further, but you get the idea.
We Live In An Amazing Time
Fortunately, we have data available (for free!) to measure every bullet point above. Sticking with our original Goldschmidt example:
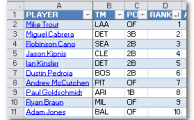
I recently finished my first rankings and projections for the 2014 season. And after I sent all the projection information into the little black box, it kicked out some really crazy looking results.
Cano, Kipnis, Kinsler, Pedroia right in the heart of the first round? Nice rankings, bonehead.
I usually assume a standard rotisserie format when creating rankings, so for a 12-team league starting 2B, SS, and MI, I assume “replacement level” is right around the 17 – 21st ranked players at each position (12 2B starters plus about 6 more drafted to play MI). When I looked at this neighborhood of players, I came up with Scooter Gennett, Jordy Mercer, Dan Uggla, Dustin Ackley, and Darwin Barney as “Replacement Level”. A sad cast of characters. Darwin Barney? How did I not catch that?!?!
I then went the next step and included this 2B replacement level measurement in the replacement level table for all positions (see the table image above). It’s very clear that something is out of whack with 2B. With the exception of catcher, which we know lacks in offensive production (and the effect is worsened for two catcher leagues), all the other positions are within 0.7 standings gain points of each other.
How I Assign Players’ Positions
It becomes very difficult to rank players that qualify at multiple positions. I haven’t found an effective way to calculate it yet. So I assign players to only one position, and I choose the position that is “weakest”. Assigning a player to the weakest position gives them the most value, so I think it’s a reasonable shortcut to deal with players like this.
What I Screwed Up
I failed to account for position changes for several very solid second base options. Specifically I still had Matt Carpenter (1B), Jedd Gyorko (3B), Martin Prado (OF), Jurickson Profar (SS), and Anthony Rendon (3B) listed at other positions. But clearly all should qualify for 2B eligibility in 2014.
And I essentially failed twice, because there are at least two other solid fantasy contributors that I still had listed as SS, but would conceivably qualify at 2B. Both Ben Zobrist and Jed Lowrie fit that bill. If 2B has such a low replacement level, players that qualify at 2B and SS to be moved to the 2B listing. Any good fantasy player would realize the weak 2B market and draft these multi-positional players to fill the void.
Replacement Level Needed To Move
So when I calculated replacement level and looked at those players ranked around the 17-21 spot for 2B, I was really looking at players 22-26.
After adding the missing second basemen, spots 17-21 shift to become Jurickson Profar, Chase Utley, Rickie Weeks, Kolten Wong, and Kelly Johnson. Then below Jed Lowrie and Marco Scutaro come in at 22 and 23. That’s more like it!
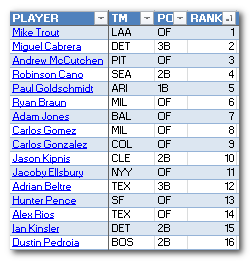
Calculating replacement level off of these players shifts the ranking calculations of every 2B, and here are the updated top 16 rankings:
Wow, what a HUGE difference. The puts the 2B more in line with what you would expect and it also has a rippling effect on other players too. Goldschmidt moves from eighth to a much more reasonable fifth.
Lessons Learned
I need to incorporate a much stronger “reasonableness check” into my rankings and not blindly trust that I entered every formula, every Excel sort, every player position, and every player ID correctly.
Don’t make the same mistake as me!
But in the end, this was a very interesting exercise that showed me just how dramatic of an effect position scarcity can play in rankings (especially if it’s done incorrectly). You always know it’s there, but it’s difficult to quantify if you don’t go searching for it.
I was just off by five or six players in determining replacement level. If it only takes a handful of players to have this big of an effect on player valuation, think about what position changes and injuries during the season can theoretically mean. Something to keep in mind for in season trading…
Thanks for reading. Don’t make unsmart mistakes like me.
I recently participated in a 2014 mock draft with representatives from BaseballProf.com, BaseballPress.com, FantasyBaseballCrackerJacks.com, and Razzball.com. Mock drafts at this point in the offseason are to be taken with a grain of salt (the draft was completed before the Fielder-Kinsler trade and before any free agency signings occurred). But it was a very interesting exercise in seeing how perceptions of players have changed after the 2013 season.
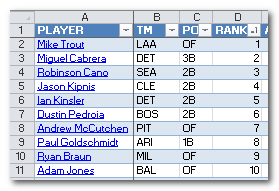
My First Round Pick Raised Some Eye Brows
I had the eighth pick. And as you can see from the results, the first six picks went as you might expect with names like Trout, Cabrera, Cano, and Goldschmidt.
Troy Tulowitzki was picked seventh, right before me (this is important, remember this).
Then it came to me and I was faced with a very difficult decision. As a subscriber to the belief that, “You can’t win the league with your first pick, but you can lose it”, I typically preach being conservative in the first round. But there was nothing “conservative” about the batch of players sitting before me:
Ryan Braun (PED risk)
Joey Votto (unspectacular of late)
Adam Jones (can’t argue with the production, but plate discipline bothers me)
Chris Davis (.240 batting average risk?)
Clayton Kershaw (too early for me at eight)
So I chose Hanley Ramirez.
The Response
To say the pick has been questioned by some is a bit of an understatement. I was called out, labelled a masochist, and called crazy (30:40 mark).
Granted, I think these things were all said in jest. But I don’t think any other pick in the draft earned comments like these.
I Don’t Get It
I completely understand this being considered risky. And I can buy into the argument that eighth is too early. But let’s put that aside for now and debate something that I think is being overlooked.
I am surprised that nobody questioned the pick of Troy Tulowitzki just one pick earlier! I think Hanley Ramirez is the number one shortstop for the 2014 season. Not Tulo.
Let’s go through the possible counterarguments.
Hanley Ramirez is Injury Prone
May I present to you games played, by season, for Tulowitzki and Ramirez:
Season
Tulowitzki
Ramirez
2006
n/a*
158
2007
155
154
2008
101
153
2009
151
151
2010
122
142
2011
143
92
2012
47
157
2013
126
86
Average
120.7
136.6
*This was Tulowitzki’s rookie year. He did play in 25 MLB games, but I exclude it from the average because he didn’t play a full year and it was not due to injury.
There’s a perception out there that Hanley Ramirez is injury prone. That should be revised to state that he has experienced significant injury problems in two of the last three years. He’s been dependable the rest of his career. And much more dependable than Tulowitzki.
Tulo has only surpassed the 140 games played threshold three times in seven years! That’s six out of eight for Hanley.
The two seasons Ramirez did not reach the 140 game mark were due to shoulder surgery and a thumb ligament injury. I have nothing to back this up, but those don’t indicate “injury prone” to me, whereas Tulowitzki’s leg injuries do earn him the “injury prone” label in my mind.
Hanley Ramirez Is Getting Old.
He’s currently 29 and will be 30 during the 2014 season. Tulowitzki is only 10 months younger.
Hanley Can’t Repeat His 21% Home Run per Fly Ball Rate
You are in the middle of the pack in the league standings, with your biggest opportunity to gain rotisserie points being in HR and RBI. Your other offensive categories are solid, but you recognize that the batting average category is tightly contested. If your team batting average were to drop a few points it would cause you to plummet in the category.
You have received this trade offer:
You Give Player A: projected for .290 BA, 80 R, 16 HR, 65 RBI, 15 SB
You Get Player B: projected for .245 BA, 80 R, 26 HR, 85 RBI, 5 SB
Trades like this are difficult to evaluate. Are the additional 10 HR and 20 RBI worth the 45 point decline in BA?
The proposed deal looks great from a HR and RBI perspective. But you have concerns about the batting average aspect. You believe the points you will gain in HR and RBI will be canceled out by the loss in batting average.
So you reject the deal.
Framing
Enter the concept of framing, or the lens through which you view and evaluate decisions. In the scenario above, this decision was made strictly under the assumption that this was a one-for-one trade.
While the offer was a one-for-one trade, you should not treat it that way. This is a narrow point of view. Your decision making can improve dramatically if you widen your frame.
Back To The Example
It’s short sighted to believe that this would be the only transaction you would make to solve your HR and RBI problem. Whether you accept this trade offer or not, your next step is probably to evaluate your bench players against the free agent list and take action there to add HR and RBI potential or to protect yourself in BA.
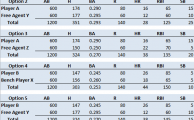
You’re not going to cut Player A. It will be someone else on the chopping block. Someone like Bench Player X.
Bench Player X: projected for .260, 60 R, 18 HR, 65 RBI, 5 SB
And let’s assume there are two interesting free agent candidates available:
In this post I am going to share with you one of the simplest and most effective fantasy baseball strategies you can implement. You’re already aware of the strategy, but I’m going to dive a little deeper and dissect it into two components. One to apply during the off-season and one for during the season.
Teach A Man To Fish…
“The fishing is the best where the fewest go…” ~ Timothy Ferriss
I cherry picked this quote from Timothy Ferriss’ book, “The 4-Hour Work Week”. I read the book for some ideas on how to improve this blog. And while it has nothing to do with fantasy baseball, this particular quote does a phenomenal job of illustrating this simple strategy I want to share with you.
We all know fantasy baseball is a competition. It’s all about gaining an advantage and differentiating yourself from your opponents.
It is impossible to differentiate yourself if you’re following the crowd. If you’re doing the same things as everyone else, you’ll get the same results. If you’re fishing in the crowded fishing holes, you’re battling for the same school of fish.
To separate yourself from the pack you have to think differently. You have to be different.
If you’re reading the same fantasy baseball advice and commentary as the rest of the competition, you’ll be battling for the same players, you’ll be employing the same strategies, and winning might just come down to luck, timing, or random variations. I hate luck!
OK. How Do I Apply This?
The easiest way to execute this strategy is to be a contrarian. To zag when everyone else is zigging. To fish where no one else is fishing.
Think to yourself about what everyone else is doing and what you can do to be and think differently.
You can implement this thinking on two levels:
Behavior and preparation
Player valuation
Let’s take a look.
1. Behavior and Preparation
This is the part of the strategy to focus on during the off-season. It is all about out working, out smarting, and “out learning” your opponents. Do things they’re not. Zag.
You might not be able to do all of these things. Not all at once and not all in one off-season. I’m sure you have a life outside of playing fake baseball games.
But if you can study up on two or three new statistics each off-season, you are developing skills and building knowledge that will help you long-term. Think about the knowledge you can accumulate after three, five, or ten years. Think about the competitive advantage you can create for yourself.
Most guys won’t be doing this. They’ll be doing mock drafts, perusing a draft guide, and reading a few sleeper articles. The same thing year-after-year. You can take advantage of this.
I’m a firm believer that to be the best at this game you have to make your own decisions. Only you can be the best manager of your fantasy team. No expert can make educated decisions for your team. By reading and studying strategy, you are building skills that will push you in that direction.
You’re off to a good start by reading this blog. I’m not here to make decisions for your team. Or to tell you who to pickup or trade for. I’m here to share important resources you can use and help you develop the skills to give you a competitive advantage.
But how can you zag when it comes to specific player-related decisions?
2. Player Valuation
This part of the strategy that applies most in-season. And despite what you might think, it has little to do with Sabermetrics. You don’t need great skill in Excel. It has very little to do with data and player analysis. This is more an exercise in economics than it is baseball statistics.
More specifically, recognizing the optimal time to buy or sell players AND acting during those times. “Arbitrage” is another word for this, as Jonah Keri discusses in his book “The Extra 2 Percent”.
Everyone Knows Buy Low, Sell High. You’re Not Telling Me Anything New.
I agree everyone knows this. But all that “buy low, sell high” advice is in terms of player performance.
We’re about to take web querying to the next level. If you’re not familiar with web queries or if you missed our first discussion, you can brush up on Excel web query basics in Part 1 the Web Queries Series here (ha, that rhymes).
You might recall that our first web query was specifically linked to Jose Fernandez’s player page at BrooksBaseball.net. This is a great way to pull his specific pitch mix into an Excel file. But it’s also pretty limiting that we can only pull in Jose Fernandez’s statistics and would have to create a new query to look up another player. At that point it’s faster to just go to BrooksBaseball.net and start searching for players manually.
What is a Dynamic Web Query?
A dynamic query would be designed in such a way so that we only have to initially set up one query. That query is not static, linked to one specific page or player, it’s dynamic, meaning it is linked to an input that can change. Said another way, instead of linking the web query to player ID “11530“, link the web query to a specific cell in Excel. Then whatever player ID is typed into that cell will be used in the web query.
A New Example
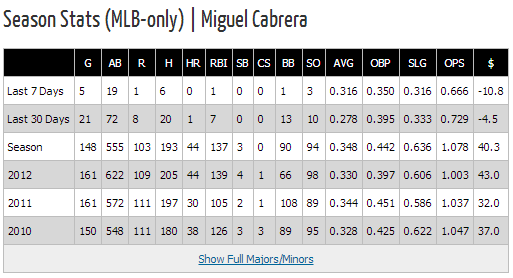
Instead of linking to BrooksBaseball.net, we’ll link to the player pages at Razzball.com. If you haven’t checked them out, these player pages over are an incredible resource. Take a look at Miguel Cabrera’s page using this link:
They load to the same page. The player’s name is not necessary for the page to load.
Stop Blabbering And Asking Me To Read Things. Show Me How To Do This.
Sorry about that. Video is more conducive to understanding this dynamic web query example. Here you go:
Have Any Questions?
Don’t just watch the video. Give this a try. You could use this to more easily do projections, evaluate trades, set the ideal daily fantasy lineup, and much more.
If you like getting your hands dirty in Excel and doing player analysis like this, sign up for the Smart Fantasy Baseball newsletter where you’ll get more great ideas like this.
“The Process”, My Latest Book, with Jeff Zimmerman
The 2024 edition of The Process, by Jeff Zimmerman and Tanner Bell, is now available! Click here to read what folks like John Pausma, Phil Dussault, Eno Sarris, Clay Link, Rob Silver, Rudy Gamble, and others have to say about the book.
The Process is your one-stop resource for better drafting, in-season management, and developing strategies to become a better manager. The book is loaded with unique studies, tips, and strategies you won't find anywhere else. Click here for more details.

 I recently finished my first rankings and projections for the 2014 season. And after I sent all the projection information into the little black box, it kicked out some really crazy looking results.
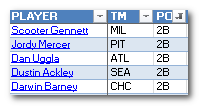 I usually assume a standard rotisserie format when creating rankings, so for a 12-team league starting 2B, SS, and MI, I assume “replacement level” is right around the 17 – 21st ranked players at each position (12 2B starters plus about 6 more drafted to play MI). When I looked at this neighborhood of players, I came up with Scooter Gennett, Jordy Mercer, Dan Uggla, Dustin Ackley, and Darwin Barney as “Replacement Level”. A sad cast of characters. Darwin Barney? How did I not catch that?!?!
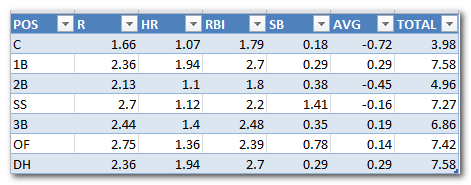 I then went the next step and included this 2B replacement level measurement in the replacement level table for all positions (see the table image above). It’s very clear that something is out of whack with 2B. With the exception of catcher, which we know lacks in offensive production (and the effect is worsened for two catcher leagues), all the other positions are within
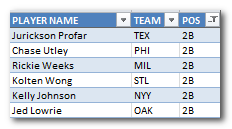
 Said another way, instead of linking the web query to player ID “