Baseball Professor

Just How Much Does Playing Time Matter?

If you’re a dedicated Smart Fantasy Baseball reader, you know I like to harp on playing time as an often overlooked and under-weighted component of player value.  Well I now have some proof to back it up!

Check out this guest post I wrote at baseballprof.com.

Baseball Professor

I took the results of a real rotisserie league of mine and analyzed the standings to find out just how important the effect of playing time was on the final standings.  Pretty tables, Excel conditional formatting, and more.

While you’re over there, please take a look around.  The guys from Baseball Professor crank out a lot of high quality content.  I can only post one or two articles a week.  So if you’re looking for more smart fantasy information to consume, check out baseballprof.com.  These guys work their tails off and it’s sabermetric-oriented, interesting, and diverse.

The group was also kind enough to invite me to participate in an early 2014 mock draft. It feels great to already get some of those draft anticipation juices flowing.  In fact, I’ve already received a few e-mails from SFBB readers about how they can start preparing rankings and projections for the 2014 season.  It’ll be March before we know it!

How To Gain Rotisserie Points On The Last Day Of The Season

How To Gain Rotisserie Points On The Last Day Of The Season

A common piece of preseason draft preparation advice is to know your league’s rules, to make sure you’re properly valuing players.  There are also some very important rules to keep in mind for the end of the season.  Rules a lot of fantasy managers aren’t aware of. Rules that will allow you a competitive advantage if you know them and how to apply them to your benefit.  

If you play in a rotisserie league on any of the major fantasy baseball providers (Yahoo!, ESPN, CBS), your league likely has some form of an innings pitched limit. Understanding how this limit is applied can allow you to gain an edge in the starting pitcher counting categories of wins and strikeouts.

The Rule

For each of these major websites, the innings pitched limit is applied at the end of the day on which you surpass the limit.  This means that you can actually surpass the limit established in your league rules by loading up on starting pitchers the day you expect to reach the threshold.

An Example

Assume your league has a 1,500 innings pitched limit.  During the final week of the season you sit at 1,490 innings pitched.  You then drop any pitcher not starting the next day and pick up a streaming option that does pitch.  You do this with all seven pitching spots in your line up.  The next day your seven starters pitch a combined 45 innings, strike out 38 batters, and earn four wins.

In this example, this strategy allows you to exceed the innings pitched limit by 35 innings, accumulating 25+ extra strikeouts and a few extra wins.  Depending on the standings in your league, this can most certainly allow you to gain a few additional points in the standings…  And maybe even win your league.

Applying This In Practice

This will be much easier to implement in daily transaction leagues where you can drop all your players on a given day and pick up tomorrow’s scheduled starters.  But you could conceivably do this in weekly lineup leagues if you plan far enough ahead.

Additionally, it only will make sense in certain scenarios.  Review your league standings to determine if you have points to gain in wins and strikeouts.  Weigh these potential points against any possible lost points if you suffer a bad ratio day (ERA, WHIP).

Thankfully it is much more difficult to move ratios significantly this late in the season.  In fact, if you have enough cushion in ERA and WHIP, consider only picking up strike out specialists, regardless of their ratios.

You need to carefully approach the innings limit first.  Be cautious not to accidentally go over before you can take full advantage of this.  I would recommend trying to get within 10 IP of the full limit.  Getting any closer could be dangerous.

Avoid a Backfire

Perform this strategy as close to the end of the season as possible.  Many managers won’t be aware of this rule and doing it too early will allow others to recognize what you are doing and open you up to a similar response, wiping out the advantage you created.  Further, you may be dropping some very good pitchers in order to pick up streaming candidates.  Trying this before the last several days of the season will allow opponents to pick up these very good players and potentially use them.

Don’t Believe Me?

Check out the rules web pages for your league host below.

Yahoo!

loophole2

ESPN

Note that ESPN has a games started limit, not an innings pitched limit.  But the same principles apply.

loophole1

CBS 

loophole3

Conclusion

This is an easy tactic to employ and you’re leaving points on the table if you don’t try it. Granted, it doesn’t make sense if you stand to lose points in ratios or if you face keeper-league ramifications.  But if you could use an extra 20 strikeouts and a couple wins, you can’t go wrong.

Make smart choices.

Are you following me on Twitter?

Smart Elsewhere #7 – End Game Plays and Moves for Next Year with Cory Schwartz

There may not have been a more targeted and useful fantasy baseball podcast all year than the September 13th episode of MLB.com Fantasy 411 podcast.  In this episode Cory Schwartz discusses a plethora of minor league September call ups that can either help you win your league this year or that have keeper-league ramifications for next year.  Later in the episode he’s joined by Paul Sporer, a favorite analyst of mine.

No matter where you are in the standings, this episode is worth 52 minutes of your time (or 35 minutes if you listen at 1.5 speed like I do).

Here’s a rundown of the episode:

  • September call ups that may help your team 0:00 – 9:00
  • Injured players and their prospects to return 9:00 – 17:15
  • Players being shut down 17:15 – 23:00
  • Paul Sporer interview 23:00 – 34:20
  • Paul Sporer and Schwartz discuss two start weeks – 34:20 – 42:45
  • Sporer and Schwartz handle listener e-mails – 42:45 – 51:53

The Players

Here are the minor league call up players Cory Schwartz discussed, with a specific focus on how they can benefit your team these last two weeks of the season.  These players are currently getting playing time but are all likely to be available in many leagues.

  • Josmil Pinto  C (MIN)
  • Chris Owings SS (ARI)
  • Tommy Medica 1B (SD)
  • Anthony Gose OF (TOR)
  • Billy Hamilton SS/OF (CIN)
  • Tanner Roark P (WAS)

The Injured

Cory also discussed several injured players and their prospects for the rest of the season.  These are guys that may or may not be useful to you in the last two weeks.

  • David Wright 3B (NYM)
  • Edwin Encarnacion 1B/3B (TOR)
  • Joe Mauer C (MIN)
  • Jacoby Ellsbury OF (BOS)
  • Allen Craig 1B/OF (STL)
  • Matt Kemp OF (LAD)
  • Howie Kendrick 2B (LAA)
  • Colby Rasmus OF (TOR)

Paul Sporer Joins The Podcast

After Schwartz discussed these end game player strategies, Paul Sporer joined the podcast to discuss next week’s two start pitchers.  And while I’m not a huge proponent of weekly head-to-head leagues, two start weeks can really help you finish a rotisserie season strong and reach innings limit caps if you’re slightly behind pace.  If you’re looking to eat up some innings, the advice of Sporer and Schwartz is definitely worth a listen.

Follow These Guys on Twitter


Are you following me on Twitter?

Links to the Podcast

Case Study:  How To Assess Your Rotisserie League Standings

Case Study: How To Assess Your Rotisserie League Standings

The case study below looks in detail at how to perform a review of your league standings.  This specific case study is written from the perspective of performing this review in late August, but reviewing and assessing your league standings is a valuable exercise to perform at any point in the season.

This review will guide the moves you make throughout the season.  It’s absolutely critical to have an in-depth understanding of the league standings.  This is not a simple exercise.  It will take time.  But that’s exactly why it’s advantageous and why it can be an advantage for you.

It’s Late August.  You’re In The Middle Of The League Standings.

How many rotisserie points can you legitimately expect to gain in the standings at this point of the season?  If you think you’re out of it, or don’t think you can catch the leaders because you’re in fifth place, I’d encourage you to take a closer look.  You might be surprised at how significantly things can still change.

The Standings

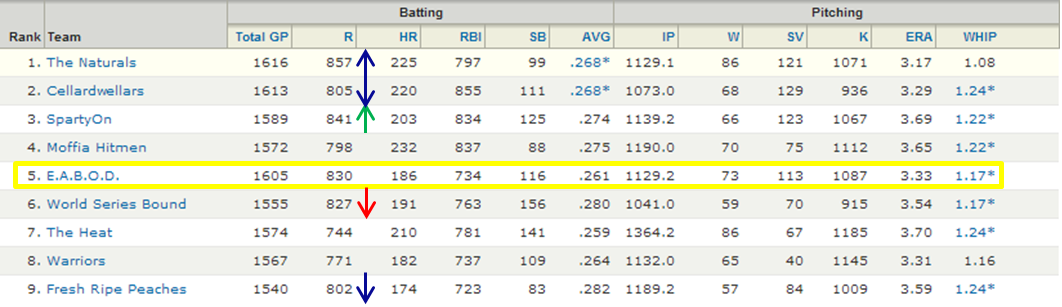
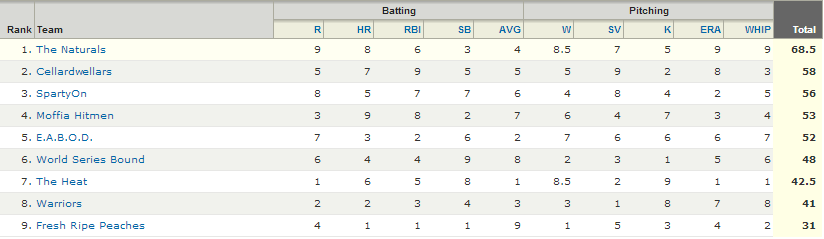
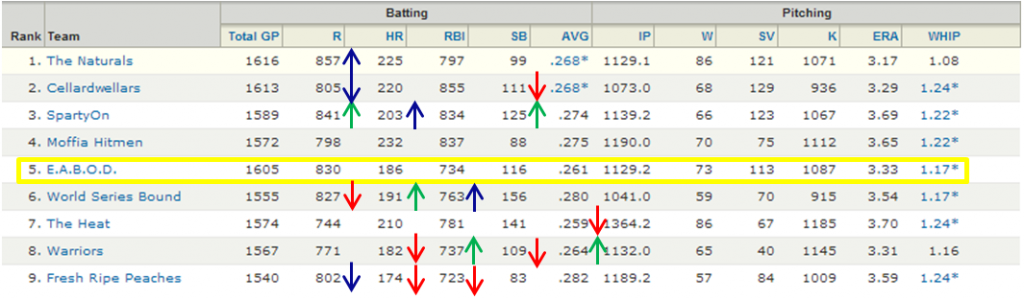
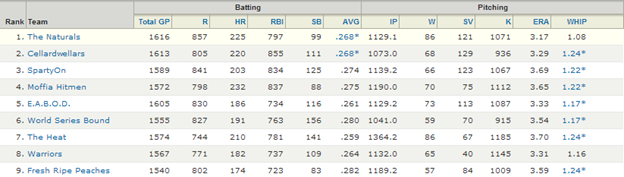
For the rest of this case study, assume the standings shown in the table below.  Let’s look at things from the perspective of the team in fifth place, E.A.B.O.D.  Does this team have a chance to catch the leader?

The first thing worth noting, besides the fact that I play in a nine team league (I’ve been trying to tell you I’m just a “regular guy”), is the first place team has a sizeable lead over the rest of the pack and sits at 68.5 points.  Then things are tightly bunched with four team near the mid-50s.

Standings1

This Is Just A Battle For Second PLace, Who Cares

We’ll take a look at if catching the first place team is possible in a moment.  But even if this is just a four-team battle for second place, taking this battle seriously, applying a well-devised strategy, and making a full-fledged effort to pass the current fourth, third, and second place teams is a valuable exercise.  What if next year it’s a four-team race for first?  Or even a two-team race?  If you’re able to win a four-team race over the last month of the season, next year’s two-team race will seem simple.

I got the idea for this case study while listening to Todd Zola on the August 9th edition of the BaseballHQ Radio Podcast.  His point was that it really doesn’t matter what place you are in the standings.  The exercise of going through a review of your team and the league standings in order to gain a few points is great practice.  Always seek to improve your team.  You’ll learn a lot from these seemingly unimportant battles.

Let’s Take A Closer Look

Remember, with roughly one month to play, we currently sit in 5th place at 52 points.  If we are to somehow pull this miracle off, we would need to reach 69 points, meaning we must somehow climb 17 points in the standings.

The best way to figure out how many points are possible?  Go category-by-category through the standings and figure out what points can easily be earned and those that could be earned with a little luck.  It’s also worth looking at the categories in which we could lose points (easily or due to bad luck).

Starting with runs, we’ve got a total of 830 runs to this point in the season.  Trying to be realistic about how many runs can actually be made up in about one month, we’ll say making up one run a day is possible, but not likely.  More likely, making up 15 runs over the next 30 days is a realistic possibility.  So anyone within 15 runs of our 830 total can be caught, giving us another rotisserie point.

Looking at the actual standings below, only one team is between our 830 runs and the attainable 845 (that’s SpartyOn with 841).  One additional team, The Naturals, is within 30 (at 857 runs to our 830).

Standings2

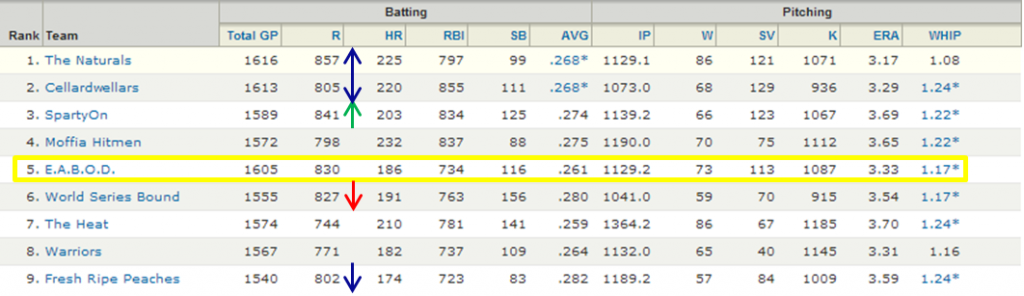
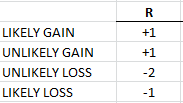
So that’s one standing point we can realistically gain (catching SpartyOn) and one more we could possibly gain, but it’s unlikely (The Naturals).  Note, if you’re also concerned about being caught in the standings, tracking the points you could potentially lose is another valuable exercise.  There is one team hot on our tails, with 827 R, and two others within 30 runs (805 and 802).

Summarizing the points we could gain or lose:

Standings13

Now extend this exercise out to the remaining hitting categories.  We’ll say anyone within 12 HR can realistically be caught and within 20 could potentially be caught.  Within 15 RBI can legitimately be caught and 30 RBI is possible but unlikely.  10 SB can reasonable be caught, 20 would be possible but unlikely.  And within .003 BA points can be caught, .006 would be possible but unlikely.

Standings3

Pitching Is A Little More Complicated

This particular league happens to have an innings limit of 1,550 innings.  Innings can be manipulated more easily than games played by hitters.  A team could theoretically start streaming a multitude of pitchers and easily increase innings in the short-term, whereas the limited number of lineup spots and days off for hitters prevents you from increasing at bats in the short-term.  This leads to potentially distorted pitching standings.

Look at the current standings below.  Take for instance, The Heat in seventh place.  The team is clearly ahead of everyone else’s pace for innings pitched and will hit the 1,550 cap soon.  The 1,185 strikeouts in 1,364 innings isn’t nearly as impressive as the 1,145 strikeouts the Warriors (eighth place) have in 1,132 innings.  The Warriors need only 40 strike outs in the next 200 IP to catch The Heat.  So we have to take the innings pitched distortion into account.

Standings14

The innings pitched distortion can only affect raw counting stats like W, SV, and K.  Pitching more or less innings can’t directly affect rate statistics like ERA and WHIP.

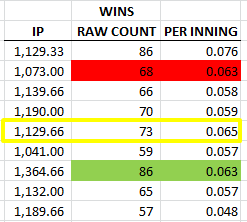
Looking more closely at wins, we can calculate the rate at which teams are earning wins by dividing wins by total IP.  This gives us “Wins per inning”.  Granted, this is an odd statistic and it’s not useful for many things, but it will help us remove the distortion caused by teams simply having more innings pitched than others.

Our hypothetical team in this case study is highlighted in yellow with 73 wins, or 0.065 wins per IP.  Looking at other teams, we actually have a higher wins per inning than the team with 1,364 innings pitched.  Even though that team has 86 wins, we are earning wins at a faster rate (0.065 vs. 0.063).  Theoretically we can pass this team simply by continuing to start our current pitchers.  Once we get to 1,364 innings, we should have more than 86 wins.

The other team with 86 wins (in 1st place) can’t be caught.  We have nearly the same number of innings (1,129.33 vs. 1,129.66), but they already have 86 wins to our 73.  And because we are in third place for wins (86, 86, then our 73), there are no more points to be made up in wins.

Standings6

(more…)

Case Study - Weighted Average Probabilities and Ryan Braun

Case Study – Weighted Average Probabilities and Ryan Braun

Hindsight is 20-20.  We all know this.  And now that Ryan Braun has been suspended for his association in the Biogenesis scandal, it’s easy to to say that we overvalued Braun in our draft preparation.  But let’s look back to what we knew in the preseason and use this as a learning opportunity to apply a lesson in weighted average probability and expected results.

What Did We Know?

News surfaced in early 2013 that Ryan Braun and numerous other players were associated with Biogenesis.  Documents were obtained that showed an official link between the players and the clinic.   There was speculation that the players involved could face suspensions during the season.

We didn’t know much more than this.  Would players miss 50 games?  100 games? Would the suspensions come down during the 2013 season?  Or after?  Could MLB even uncover enough evidence to support suspensions?

What Could Happen?

For Braun, we could reasonably assume he’d be the target of a 100-game suspension. He was nearly the recipient of a 50-game suspension in the fall of 2012, but managed to avoid it on a technicality.  So new evidence could push him from a first-time offender to a second-time offender (and a 100-game penalty).

Let’s Start A Basic Projection For Braun’s 2013 Season

If we are to build a projection for Braun’s 2013 season, a reasonable place to start would be to look at career averages.  Braun played a partial season in 2007 and played at least 150 games in 2008-2012.  So let’s use these last five years of “full seasons” and figure out the average production as our baseline estimate:

WAP1

These average to 154 games, 672 plate appearances, 34 home runs, 105 runs, 109 RBI, and 22 SB.

But What If This Isn’t An Average Season?

We know Braun was nearly caught as a PED user in 2012. So what if he was scared into stopping his use of PEDs?  Can we build this into our estimate?

We don’t have any scientific data to understand the exact effect of PEDs.  So let’s throw out a rough guess and say we think the effect of stopping the use of PEDs would slightly decrease his production.  We’ll say his numbers would remain at 154 games and 672 plate appearances, but he drops to 25 HR, 90 R, 90 RBI, and 20 SB.

To summarize our two scenarios:

WAP2

How Likely Are These Scenarios To Occur?

You might have your own beliefs about the likelihood of each, but for the sake of example let’s say we think Braun is 90% likely to have another year in line with his past five seasons and 10% likely to experience a year where the effect of no PEDs drags his performance down some.

WAP3

And What If He Gets Suspended?

Again, for the sake of illustrating a simple example, assume a 50% chance Braun does not get suspended during the year and a 50% chance Braun misses half the season.

These 50-50 alternatives are subsets of our previous two scenarios.  So the 90% chance Braun has another average year now becomes a 45% chance (90% * 50%) he has a career average year and does not get suspended and a 45% chance he has a career average year and does get suspended.

Likewise, the 10% chance he sees a drop in productivity due to coming off PEDs is split into a 5% bucket of not being suspended and a 5% bucket of being suspended.

Regardless of the scenarios we lay out, we must remain at 100% total probability for all the possible outcomes.  Something has to happen.  And with 45, 45, 5, and 5, we’re still at 100%.

WAP4

Weighted Average Probability, Expected Results

Once you have probabilities for each possible outcome, it’s easy to calculate the total expected result.  We simply multiply the expected statistics for each scenario by the likelihood of that scenario.  This is the “weighting”.

Look at the 5 Year Avg – No Suspension example.  We have determined this scenario has a 45% chance of occurring.  45% multiplied by 672 plate appearances is 302.40.  45% multiplied by 34 home runs is 15.3.  And so on.

Here are the weighted averages of all scenarios:

WAP5

Our overall or actual expectation is the sum of each different weighted scenario.  You can see this total at the bottom of the table above.  After taking all possible scenarios and their probabilities into account, we estimated Braun for 25 HR, 78 R, 80 RBI, and 16 SB.

The Bigger Point

This approach of calculating weighted average probabilities can be used in many different scenarios.  Do you think there’s a 25% chance Troy Tulowitzki plays a full season, a 50% chance he plays 120 games, and a 25% chance he plays 80 games?  Do you think a rookie has a 25% chance of being called up in May, 25% in June, and 50% in July?  Do you think there’s a 50% chance a player will bat leadoff during the year and a 50% chance he’ll bat 9th?  Is there a 25% chance a rookie call-up will break onto the scene and be very productive, a 50% chance he’ll be an average player, and a 25% chance he’ll be sent back to the minors?

In any of these situations, calculate an estimated outcome and weight it using the probability of that outcome occurring.

Be Smart

Thanks for reading and continue to make smart choices.

Trading Strategy - Take Advantage of Misperceptions

Trading Strategy – Take Advantage of Misperceptions

What’s done is done.  April, May, June, and July are behind us and we’re heading into the stretch run.  If you’re still able to make trades in your league, here’s a strategy you can employ to squeeze a little extra out of a deal or to get a player at a discount.

Leagues are going to be decided by what happens over these last two months.  Today’s standings are based upon the past, but they will only change due to the statistics that will be earned going forward.  

So as we stand here today, we only care about the future.  This sounds obvious.  You know this.  I know this.  But many owners are unduly influenced by the past, by year-to-date statistics.  It’s impossible to avoid a player’s accumulated season-long statistics.  Visit player X’s profile page online or watch their game on TV and you’re bombarded with graphics showing they have 23 HR, 72 RBI, and 8 SB.  

There’s an opportunity here.

PAST PERFORMANCE IS NOT INDICATIVE OF FUTURE RESULTS

That player with 23 HR, 72 RBI, and 8 SB could very easily be less productive down the stretch than a player that currently has 8 HR, 27 RBI, and 2 SB.  There are players out there that have depressed counting statistics at this point in the season.  Maybe they were injured.  Maybe they have underperformed.  Or maybe they weren’t in the Major Leagues all season.

This is an opportunity for arbitrage.  It’s about finding your own 23 HR-72 RBI guys (especially if you smell a decline coming) and swapping them for other teams’ 8 HR-27 RBI guys.

What To Look For?

If you have a tradeable commodity, a player with impressive accumulated statistics, target players that are due, or are already experiencing, increased opportunity. Additional opportunity can come in many shapes and forms.  It can come from being injured early in the season and now playing regularly.  Or being a bench player early in the year and being pushed into a starting role due to injuries.  Moving to a more valuable spot in the lineup.  Being traded to a more productive lineup.  Being called up from the minor leagues.

It is this opportunity you should be looking for.  Skills remain relatively constant.  But opportunity can change significantly in a short period of time.

On draft day, players thrust into starting roles see their value sky rocket.  They’re termed sleepers.  Everyone in the league battles for them.  When the same thing happens in mid-August, many managers won’t notice.  And if they do, they won’t react in the same rabid manner.

Give Me Names

Here are some examples of players that will have strong opportunities to play the rest of the 2013 season and have depressed counting statistics for some reason (due to injury or being called up during the year).  If you offer up player(s) that have been healthy and played all season in exchange for players like those from the list below, the perceived difference in counting statistics may allow you to earn a slight “discount”.

  • Aaron Hill
  • Brett Lawrie
  • Jason Heyward
  • Curtis Granderson
  • Giancarlo Stanton
  • Carl Crawford
  • Brad Miller
  • Bryce Harper
  • Austin Jackson
  • Nick Franklin
  • Wil Myers
  • Jonathan Villar

A Real Example

You’ll have to determine your team’s needs.  But look at the potential trade below.  To this point in the season, Leonys Martin has stolen 27 bases, good for 10th best in the major leagues.  Jonathan Villar has only been in the major leagues since July 22nd and stolen 11 already.

Granted, Villar could hit .200 and be sent back to the minors in a few weeks.  But you should easily be able to trade a Leonys Martin for a Jonathan Villar AND get something else.  Heck, you could get something significant and Villar might be a throw in.  If you’re trying to gain ground in the standings, this is the type of risk you need to take on.

AccStats1

Don’t Fall Victim

So what can you do if you’re offered a trade like this?  How can you properly evaluate the offer?

The answer is to be forward looking.  Consider completely ignoring the statistics accumulated to this point and use one of the free and reliable rest-of-season projection systems that are available.  These are updated each day and give you only the projected stats for each player going forward.

Conclusion

This won’t always work.  A skilled manager might be as disciplined and forward looking as you.  But many managers can’t help but be overly influenced by the past.  If you can combine the tactic above with other strategies to engineer a trade, you’ll be well on your way to pulling off a deal that can help you down the stretch.

Make smart choices.