The Buzz About Profar

The Buzz About Profar

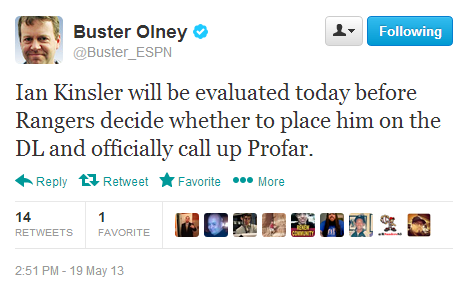
Buster Olney just sent sizeable shock waves through the fantasy baseball landscape with this news:

OlneyTweet


Profar has sense been officially called up to the Texas Rangers.  With the amount of buzz being generated by this news, it’s time to revisit the idea that the values of players go through artificial and unfounded changes.  With news of his call up, Profar’s value to players in single-year/redraft leagues may never be higher during the 2013 season.

A few things to keep in mind about Profar:

  • He’s been touted  as the number one prospect in baseball for some time now
  • There is often confusion as to what it means to be the number one prospect.  This means he’s the best real-life baseball prospect.  Position scarcity benefits Profar (playing shortstop).  Defensive abilities are a factor in the ranking.  These things have no direct effect on our fake baseball teams’ performances.
  • He is only 20 years old.
  • He’s been roughly a .275-.280 hitter over his 3+ seasons in the minor leagues
  • If you take his minor league career average per game numbers and extrapolate them to a 162 game season you come up with 110 R, 16 HR, 80 RBI, 25 SB, 42 doubles.
    Year Age Tm Lg G PA AB R H 2B HR RBI SB CS BB SO BA OBP SLG
    2010 17 TEX-min A- 63 288 252 42 63 19 4 23 8 3 28 46 .250 .323 .373
    2011 18 TEX-min A 115 516 430 86 123 37 12 65 23 9 65 63 .286 .390 .493
    2012 19 TEX-min AA 126 562 480 76 135 26 14 62 16 4 66 79 .281 .368 .452
    2013 20 TEX-min AAA 37 166 144 27 40 7 4 19 6 1 21 24 .278 .370 .438
    Provided by Baseball-Reference.com: View Original Table
    Generated 5/19/2013.
  • If you believe he can make a smooth transition to the major leagues, this would put him somewhere in the neighborhood of being a top-eight fantasy shortstop (those numbers are similar to preseason projections for Ben Zobrist, Jimmy Rollins, Asdrubal Cabrera).
  • While he’s joining a strong MLB offense, we don’t know where he will bat in the TEX lineup.  He’s been batting second in AAA.  His spot in the lineup can significantly affect his run and RBI production.
  • The move is the result of Ian Kinsler being placed on the DL.  Profar may not even have sole ownership of the second base job while Kinsler is out.  Ron Washington has stated that he will share time with Leury Garcia.
  • When Kinsler returns, the Rangers will still have playing time and lineup issues to sort out.  Kinsler has played in 945 career games.  He’s played 2B in 944 of them.  He’s never played the outfield.  He’s never played first base.  Mitch Moreland has played the outfield.  But he’s only played right field.  Nelson Cruz plays right field.  He has played a small amount of left field.  But not much.

Make An Educated Decision

I’m not saying to avoid Profar.  Or to move him if you own him.  But there are a multitude of factors that suggest his value may be at an all time high soon after he is called up.  There is buzz.  It’s “cooler” to own the top young prospect than it is to own an aging veteran like Jimmy Rollins (even if they put up similar numbers).

If you own Profar in a single-year/redraft league, it’s at least worth your time to float him to the league and see what kind of offers arise.  If you don’t own him but would like to buy, be aware that his price may be at an all-time high.

Get smart.

A Major Error In Evaluating Fantasy Baseball Trades

As my three-year old daughter would say, “Let’s pretend…”.

Let’s pretend you’re a young boy.  Your Dad works at a factory that produces Snickers bars.  Each Friday he brings you a king-sized Snickers bar home from the factory.  Accordingly, you’ve had a lot of Snickers bars in your life.  More than any one in the neighborhood.

Your good friend Timmy lives down the street.  His father also works at a candy bar factory, but he works in the Mounds bar facility.  Each Friday Timmy’s dad brings him home a regular-sized Mounds bar.

Every king-sized Snickers bar you eat is a little less satisfying than the previous one.  Every regular-sized Mounds bar Timmy eats is a little less satisfying than the previous Mounds bar.

You long for a Mounds bar.  Timmy would kill for a Snickers.

Let’s Make A Deal

Even though you have a king-sized Snickers bar, you would gladly trade it for Timmy’s regular-sized Mounds bar.  You’ve had enough Snickers bars.  Enough chewy nougat.  Enough gooey caramel.  Snickers mean little to you at this point.  You want almonds.  You want coconut.  The smaller Mounds bar provides more benefit to you than the larger Snickers bar.

If you really want a Mounds bar, it would be foolish to keep a Snickers bar that has no value to you, despite the Snickers bar being larger in size than the Mounds bar.

That’s The Key

A trade should be evaluated on the benefit it provides to you relative to the cost you must pay.  The smaller Mounds bar provides great benefit to you.  Giving up the larger Snickers bar has little effect on your level of happiness.

The Major Mistake Often Made

But that’s not what we see in fantasy baseball.  The mistake fantasy managers often make is to compare their own cost to the cost of the other owner.  The benefits to their team are ignored.

“Well, I’m not going to give you my king-sized Snickers bar for your regular-sized Mounds bar.”

Or, “I’m not going to trade you my 50th ranked player for your 80th ranked player”.

The ranking of the player should not be the determining factor in your decision.  The decision should hinge upon if the 80th player can help your team more than the 50th player can.

How Could the 80th Ranked Player Help Me More Than the 50th ranked Player?

There are a lot of scenarios where this could occur.  If you have a weak middle infield but a strong outfield, trading an OF ranked #50 for a SS ranked #80 could significantly upgrade your team’s overall level of production.  Or if you are leading the league in home runs but are last in steals, trading a higher ranked power-hitter for a lower ranked stolen base specialist makes great sense.

But Do Your Homework

If we go back to the candy bar example, we’ve reached the conclusion that it makes sense to trade your king-sized Snickers for Timmy’s regular-sized Mounds.  But you also know that Sally’s dad works at the king-sized Mounds factory.  And Johnny’s dad works at the Skittles factory and brings him home a pack every day (instead of just on Fridays).

It makes sense to trade with Timmy.  But you also have a responsibility to make sure Timmy’s offer provides you the highest BENEFITS for the cost of the Snickers bar.  Your best strategic play is to make/solicit offers from a variety of others to maximize the benefit of trading your Snickers bar (don’t ever make a trade by negotiating with just one manager).

The Coin Is Two-Sided

You must also consider the benefit you are providing to the other team in the trade.  A trade can only occur when both parties come to the realization that the benefits of the players received exceed the cost of the players traded away.  If Timmy’s parents are divorced and his step-father that’s trying to buy his affection works with your Dad in the Snickers bar factory, you’re screwed.

Do Us All A Favor

If you find yourself attempting to work out a trade with someone hung up on player rankings or unable pull the trigger because, “He’s giving more in the deal than you are”, tell them the fascinating story of Timmy and his Mounds bar.

Learn something smart every day.


What is Regression Toward the Mean?

Read an article about baseball analysis or listen to a sabermetrically slanted podcast and you’re bound to come across the term “regression toward the mean” or a remark that “player X’s BABIP is bound to regress”.  But what exactly does this mean?  For God’s sake, the last statistics class I took was my sophomore year in college.  Even the least technical baseball analysts throw this phrase around like it’s common knowledge.

A Practical Example

Generally speaking, the average BABIP in Major League Baseball is in the neighborhood of .300.  There are a variety of factors that can influence a player’s BABIP to be higher or lower than that mark, but disregard that for this simple example.  For this next discussion let’s assume that just like the odds of a coin being flipped heads are .500, for the odds that any ball batted into play will result in a hit are .300.

So in this example world, if we took a group of 100 fantasy baseball hitters and let them play out an entire season, we would expect the BABIP for each individual, and for the group, to be .300.  Just like flipping a coin 100 times won’t always results in 50 heads and 50 tails, we realize that some players will have a BABIP much greater than .300 and others will fall greatly below .300.  Those with BABIPs over .300 will have benefited from luck, while those under .300 experienced bad luck.

Now assume the players were split into two groups.  One group of the 50 highest BABIPs in our fake world.  And the other group of the 50 lowest BABIPs.

Because every batted ball has a three-in-ten chance of being a hit (.300), even for the group of the 50 highest BABIPs we would still expect their batting average on balls in play to be .300 in the second season.  Likewise for the hitters with the lowest BABIPs.  Even though they had a low BABIP in the first year of our experiment, we would still expect a BABIP of .300 in the second year.

That’s What Regression Towards The Mean Is

Despite an above average performance in the past, you would still expect the player to have a .300 BABIP in the second year.  You expect their BABIP TO REGRESS TOWARD THE MEAN of .300.

The term regression applies to both those that outperformed in the past and those that underperformed.  A player with a BABIP of .250 in the first year of the experiment would be expected to “regress” toward the mean of .300.

Don’t Make a Huge Mistake

A common mistake is to assume that someone who has been lucky in the past will “punished” or experience bad luck in the future.  THIS IS NOT TRUE.  If you flipped a coin 10 times and it landed on heads all 10 of those flips, you would still expect five heads on your next 10 flips.  You would not expect zero heads or 10 tails.

If a player gets off to a “hot” or “lucky” start, you can expect them to “cool off” (or regress toward the mean).  But it would be a mistake to believe they will become “cold” or “unlucky”.  You should expect them to move toward their “average” or “expected” level.

Shall We Play A Game?

At the time of writing, Carlos Gomez’s BABIP is .421.  Assuming our simple world where every player is expected to have a BABIP of .300, what would “should” Gomez’s BABIP be at the end of the season?

A.  Something greater than .300

B.  .300

C.  Something below .300

The correct answer is….  A!  Let’s take a look.

To this point Gomez has a .421 BABIP based on 45 hits on balls in play and 107 total balls batted into play (45 / 107 = .42056).

Gomez has played in 39 games.  So we’re roughly 25% into the season.  Going through a very rough calculation, we would then assume through the next 120 games Gomez will put the ball into play 321 times (107 through roughly 40 games * 3 = 321 balls put into play for 120 games).

And if we assume a .300 BABIP on those 321 balls put into play, that calculates out to 96 hits on balls in play (.300 * .321 = 96).

For the season we have:

45 + 96 = 141 hits on balls in play

107 + 321 = 428 total balls put into play

141 / 428 = .330 BABIP for the season

Those 45 hits on balls in play are already “in the bag”. They cannot be taken away. So the end result should be a BABIP over .300 for the season.

Apply This Elsewhere, With Caution

Regression towards the mean can be applied to other statistics.  You must be careful to apply it only to statistics that are not significantly affected by skill.  For instance, good pitchers with good fastballs and “stuff” and deception and good control are simply going to strike out more batters than bad pitchers with poor control and limited ability.  It would be a mistake to expect a skilled pitcher’s strikeout rate to regress toward the league average.

Statistics like pitcher home run per fly ball, line drive percentage, and left-on-base percentage tend to fall in predictable ranges.  Extreme deviations from average are likely due to regress.

Realize THAT WE DON’T LIVE IN A SIMPLE WORLD

It’s very important to realize that we don’t live in a simple world.  Especially as it applies to baseball.  To some extent, all statistics in baseball can be influenced by the player’s skill level.

While nobody has been able to consistently flip heads on a coin 60% of the time, certain players have been able to consistently achieve BABIPs higher than .300.  We know faster players can achieve higher BABIPs.  But slow players have done this too.  Some pitchers can consistently control home runs per fly ball.  Some hitters consistently hit line drives.

The Take Away

It’s important to understand the concept of regression and to know the common pitfalls in applying the principles.  At the very least you can use this knowledge to identify “experts” that need to revisit their college statistics text book.

Make smart choices.

Smart Elsewhere #4 – How Late is too Late?

Two weeks ago, Dave Cameron of Fangraphs (follow Dave on Twitter) wrote an article outlining why the Blue Jays were in serious trouble of missing the playoffs.  The issue is not just that they are off to a slow start.  There is room to be off to a slow start early in the season, but by April 29th, they had already fallen significantly behind the Red Sox in the A.L. East.  The slow start coupled with the Red Sox hot start puts them in a group where only 1 of 32 teams facing such a deficit recovered to make the playoffs.

What Does This Have To Do With Fantasy Baseball?

The question is, how late is too late to make a comeback in fantasy baseball?  What statistics are necessary to engineer a climb?  What strategies are necessary the further down the standings my team is as we get deeper and deeper into the season.  Tristan H. Cockroft (follow Tristan on Twitter) attempted to answer these questions from both the hitting and pitching perspectives.

The main point in Cockroft’s articles is that ratio stats like batting average, ERA, and WHIP are much harder to change as the season goes along.  Mathematically speaking, as more of the season passes, more innings and at bats have been accumulated, and it becomes increasingly difficult to budge the ratios.  If you’re at the bottom of the standings in a ratio statistic like batting average, you’re nearing the point of no return.

With this in mind, let’s apply some strategic thinking…

  1. Make it a point to give your league standings a close look once a week.  This means reviewing the standings within each individual rotisserie category.  Develop a rough count of how many points you can realistically move up in the short-term.  Also be mindful of how many points you could fall in the short-term (you might need to defend your position in a category).
  2. Now that you have a grasp on your place in the standings, determine your best course of action.  If you’re trailing in a particular category, begin to target specialists that can help you gain ground.  If you need home runs, look into someone like Mike Morse (his owner might be fed up with his .230 batting average).  If you need stolen bases, look for Juan Pierre or Dee Gordon-types or players that may soon make an impact in that category (Adam Eaton, Eric Young Jr.).
  3. Are you within striking distance of the leaders?  Or is there a cluster of teams you can still easily reach after a good week?  Maybe no moves are necessary at this time.
  4. Are you developing a significant lead in any categories?  Or even if you aren’t “winning” the category, have you developed a sizeable gap between yourself and the team behind you in the category?
  5. Determine if “playing it safe” and making minor adjustments is sufficient to hang around with the other leaders.  Or decide if it’s necessary to start throwing haymakers and taking risks to get back into the race (think huge upside plays that could potentially be acquired at a “discount” like Wil Myers, Josh Hamilton, Hanley Ramirez, Giancarlo Stanton, B.J. Upton, etc.).
  6. In an extreme situation, maybe you consider embracing a poor batting average and aggressively attacking the other categories

As always, keep a level head when making transactions.  Don’t overdo it.  A couple of seemingly minor acquisitions could be enough to gain significant ground in the standings.

Do you have any tricks or rules of thumb you apply when reviewing your rotisserie standings?  Share your thoughts in the comments below.

Don’t Just Sit There

Go look at your standings today.  Identify a weakness in your team or a category in which you can improve.  Make one smart move to address this concern.

Stay smart.


Fantasy Baseball Tool Box - PITCH f/x Part II

Fantasy Baseball Tool Box – PITCH f/x Part II

Welcome to part two of our dive into PITCH f/x, a source of data you can use to take your analysis of pitchers to the next level.  In this installment, we’ll look more closely at the specific types of information that can be applied to fantasy baseball analysis.

In case you missed it, part one of the series covered an introduction of the PITCH f/x system, an overview of the types of information provided, and the best resources on the web to review PITCH f/x data.

Pitch Types

When doing analysis of PITCH f/x data, you will run across a system of abbreviations to classify pitches into different pitch-types.  For example, a player card for Clayton Kershaw at BrooksBaseball.net would display (among many others) the following pitch percentage chart:

KershawPitchFX050513
Clayton Kershaw Pitch-Type Chart from BrooksBaseball.net

The abbreviations FA, FC, SL, CU and CH stand for Fastball, Cut Fastball, Slider, Curve, and Changeup.  You might have figured many of these out, but the following table lists all abbreviations and their related pitch-type:

Abbreviation Pitch Type
FA Fastball
FT Two-seam Fastball
FC Cut Fastball (Cutter)
FS Sinking Fastball / Split-Fingered (Splitter)
FO Pitch Out
SI Sinker
SL Slider
CU Curveball
KC Knuckle-curve
EP Eephus
CH Changeup
SC Screwball
KN Knuckleball
UN Unidentified

Pitch Velocity

Each player card at  BrooksBaseball.net is usually clearly labelled with “mph” in the header.

Velocity

When using the PITCH f/x data at Fangraphs, note that velocity statistics have a “v” prefix (vFA is Fastball Velocity, vCU is Curveball  Velocity, etc.).  This table at Fangraphs can easily be sorted by velocity to see the hardest throwers.

PitchVelocity
2012 Fastball Velocity (vFA) leaders from Fangraphs.com.

And remember, Fangraphs data can be exported into a csv file for use in other analysis.

ExportPitch Outcomes – BrooksBaseball

In addition to tracking the pitch-type and velocity, the outcome of each pitch is tracked.  BrooksBaseball.net breaks down balls and strikes by pitch-type (called strike or swinging strike).  Swings are then broken down into balls put in play (BIP), fouls, and swings and misses (whiffs).  Finally, balls put in play (BIP) are then divided into ground balls, line drives, fly balls, and popups.

pitchfx3-050513

I believe there must be some pitch outcome results that are unknown, because the math doesn’t always work out in these tables.  Take the chart above, for instance.  For any pitch type, the ball percentage, called strike percentage, and the swing percentage should add up to 100%.  A hitter can either have a ball called, a strike called, or they can swing. But 18.20% + 48.08% + 19.70% = 98.50%.  Similarly, when the batter swings, the outcomes can be a foul, a swing and miss (whiff), or the ball in play (BIP).  But for the fourseam fastball, 19.70% + 8.18% + 20.70% = 48.58%, not the 48.08% swing percentage.  Outside of some inconsistencies like this, the data is great.

Sabermetric Outcomes – BrooksBaseball

The Sabermetric Outcomes table provides some very useful figures for analysis.  The “Whiff/Swing” figure tells what percentage of time a player misses when they decide to swing.  This can indicate if a pitcher has “swing and miss stuff”.  You can look at this trend over time to see if strikeout skills are improving or deteriorating.  It may also indicate that if a pitcher were to change his pitch mix/composition, that a change in strikeouts might occur.  For example, if you see that Kershaw is begins to throw more or less sliders, his best “swing and miss” pitch at 42.38%, his total strikeouts might be more significantly affected.

pitchfx4-050513

Plate Discipline – Fangraphs

On the Fangraphs pitching leaders page, it’s possible to view a “Plate Discipline” breakdown PITCH f/x data .

pitchfx050513

The plate discipline statistics will contain some measures relevant for fantasy baseball like  the frequency of swings at pitches outside the zone (O-Swing%), frequency of swings at pitches inside the zone (Z-Swing%), and the frequency a batter makes contact with a pitch inside the strike zone when they’ve decided to swing (Z-Contact%).

pitchfx2-050513Thanks, and Stay Tuned

You now know how to locate PITCH f/x data and do some basic analysis.  More specifically, you know how to view pitch mix/composition, you know how to read the pitch type abbreviations, how to locate pitch outcome data, and how to download certain reports for use again later on.

In an upcoming post we’ll take a look at a  real-life example of how to use this data for player analysis.

Be smart.

Running the Math on Early Season Batting Averages

Running the Math on Early Season Batting Averages

We’re now into May.  For the last month you’ve been beaten over the head with fantasy advice telling you to wait until at least May before making any significant moves.

You’ve exercised patience.  You haven’t made any brash decisions.  But maybe you’re still sitting with B.J. Upton (.149 BA), Ike Davis (.167), Will Middlebrooks (.193), Jose Bautista (.205), Edwin Encarnacion (.221), Matt Wieters (.224), or Martin Prado (.232) on your team.

Or maybe you’re me, with all of them…

RunTheMath
Unfortunately, they’re not really on the bench. I just ordered them this way to show them next to each other. Perhaps foolishly, I trot most of these guys out into my lineup every day.

But what do these batting averages mean?  How bad are they?  How far are they from being acceptable?  What would one good week do to a struggling player’s average?

I’m Glad You Asked

But first, let’s gain a little perspective.  I may have a fundamental flaw in the construction of this team, because with the exception of Prado, none of these guys could be expected to hit .300.  Here are their current year and career batting average and BABIP at the time of this article:

RunTheMath1
Current Year and Career BA and BABIP, Stats Courtesy of Fangraphs

From looking at the career BABIPs and their BABIPs to this point, it’s clear that each of these players has been “unlucky” to some degree (many of their BABIPs are 80 to 100 points below career levels).  

With that in mind, let’s play a simple game of “what if”.

What If Each of These Guys Had Five More Hits Since Opening Day?

As I mentioned above, we’re at about the 30 game mark for most teams.  We’re at the end of the fifth week.  What if, over the five weeks, each of these players had JUST ONE MORE HIT EACH WEEK?  I’m not asking for the world here.  Just one more hit each week, for a total of five more hits since opening day.

RunTheMath3
Scenario 1 – Each Player Has One More Hit Each Week of the Season So Far (five more hits)

Look at the column “BA w/ 5 More Hits”.  That looks a lot better, doesn’t it?  Most of the players see their average jump at least 50 points.  In fact, of the seven players listed, three of them (Bautista, Encarnacion, and Wieters) actually SURPASS their career batting averages under this scenario.  And four of the seven players reach the .250 mark (Bautista, Encarnacion, Wieters, and Prado).

Things are not as bad as they seem.

Yeah, But Those Five Hits Didn’t Happen…

You’re still skeptical?  I’d be seeing the glass as half-empty too if I had any of these batting average leaches on my team…  Oh wait.  I have them all.

But if you’re not sold on five bloop hits dropping in over the course of a month, let me propose another scenario.

What If Each Of These Guys Has A Good Week Starting Tomorrow?

And let’s keep it reasonable.  We’ll say they go 10-for-25 next week for a .400 batting average.   (more…)

Courtesy of MLB.com Gameday

Fantasy Baseball Tool Box – PITCH f/x

If you’re looking for another weapon to add to your fantasy arsenal, understanding and using PITCH f/x data is a great place to start.  This article will give you an overview of what PITCH f/x is, what information it provides, and how and where you can obtain PITCH f/x data on the web.

What Is Pitch F/X?

PITCH f/x is a system, developed by Sportvision, installed in all Major League Baseball stadiums to track the movement and velocity of pitches.  Even if you’ve never heard of PITCH f/x or analyzed PITCH f/x data, you’ve probably seen it in action via MLB.com’s Gameday system.  The pitch animations within Gameday attempt to model the actual velocity, break, and angle of pitches.

PITCH f/x animation from MLB.com’s MLB Gameday

While watching the Gameday animation, if you hover over the location of a pitch, you are presented with the pitch result, pitch type, speed, and movement.

pitchfx1
PITCH f/x information from MLB.com’s MLB Gameday

What Does Pitch f/x Tell Me?

It’s interesting to look at the data of individual pitches, but because pitch-after-pitch-after-pitch is recorded and logged, we have accumulated a massive amount of pitch data that can be analyzed.  With pitch type, pitch speed, pitch movement, and pitcher release point being available, we can answer questions like:

  • Has pitcher A altered his approach (pitch type frequency)?
  • Has pitcher B added a new pitch?
  • Has pitcher C added velocity from the prior year?
  • Has pitcher D lost velocity on his fastball?
  • Has pitcher E improved the movement on his pitches?
  • Has pitcher F changed his release point?
  • What percent of the time does pitcher G throw his curve ball for a strike?
  • What pitch type for pitcher H generates the most swinging strikes?

What Does This Have To Do With Fantasy Baseball?

There are some very obvious applications.  For one, higher fastball velocity is an indicator of higher strike out rates.  Decreasing velocity might indicate an injured or aging player losing effectiveness.

Other PITCH f/x information is more difficult to tie directly to fantasy performance, but knowing the information might help explain changes in a player’s performance.  Take the case of Edward Mujica, who became a different pitcher after being traded to St. Louis in 2012.  Turns out he developed a new pitch that he now throws over 60% of the time.  Adding a new pitch and then throwing it with a high frequency would help explain an increase in effectiveness.

Fantasy players are always trying to determine what is real and what performance increases will continue.  PITCH f/x data can help unearth the “real” changes in pitcher performance and separate them from a flukey “hot streak”.

Where Do I Find Pitch f/x Data?

There are a number of resources for PITCH f/x data, but my two favorite sources are BrooksBaseball.net and Fangraphs.  BrooksBaseball.net offers a ton of information if you’re looking to take a deep dive into an individual player, whereas Fangraphs offers the easiest access to downloadable PITCH f/x data.

Brooks Baseball

BrooksBaseball.net offers PITCH f/x analysis of individual games, of umpires, and of the strike zone, but the pitcher “Player Cards” are what I find most useful for fantasy baseball analysis.

To access a player card, simply type the player’s name into the search box on the main site.  Then click the search button.

pitchfx2
BrooksBaseball.Net Player Card Search

You’ll be presented with a lengthy table of contents showing just how much information is available on the site.

pitchfx3
BrooksBaseball.net PITCH f/x Player Card Table of Contents

We’ll dive deeper into certain segments in a future post.  But in the meantime, look around.  The information is awesome.

Fangraphs

As mentioned above, Fangraphs offers the best sortable and downloadable PITCH f/x information I’ve been able to find.  To access this information, go to the “Leaders” menu at Fangraphs and select the desired year under “Pitching Leaders”.

pitchfx4
Accessing Fangraphs.com Pitching Leaders

Middle of the way down on the ensuing page, you’ll see categories for all the pitching statistics available at Fangraphs.  Choose “PITCH f/x”, the rightmost option.

pitchfx5
Locating PITCH f/x data on Fangraphs.

After making that selection, you have further options to choose from:  Pitch Type, Velocity, Movement, and others.

pitchfx6
Categories of PITCH f/x data available on Fangraphs.


More To Come

Play around with the information at BrooksBaseball and Fangraphs.  Leave a comment below or let me know on Twitter if you have any questions.

In an upcoming post, we’ll dive deeper into the data and do some analysis.

Special Thanks

A big thank you is in order to BrooksBaseball.net and Fangraphs.com for offering such great information online and making it available to smart baseball fans.

If You Haven’t Already Done So

Please subscribe to the Smart Fantasy Baseball blog with your e-mail on the top right of this page.  I won’t sell your e-mail address and you can unsubscribe at any time.  Promise.

Until next time, make smart choices.


Smart Elsewhere #3 - Brett Talley on Exploiting Matchups to Increase Stolen Bases

Smart Elsewhere #3 – Brett Talley on Exploiting Matchups to Increase Stolen Bases

Take a look at the final standings in one of my leagues last year:

SmartElsewhere3

Note the tie for first place.  And then note the closeness amongst the teams in stolen bases.  Teams finished with 158, 159, 161, 162, 164, and 167.  If the team at 158 could have squeaked out 10 extra steals, they could have conceivably earned five extra points in the standings.

In this edition of Smart Elsewhere, Brett Talley (follow Brett on Twitter), a writer for the Rotographs pages of Fangraphs, takes a look at an approach you can use to try to squeak out 10 extra steals over the course of the year in his article, “Pitchers and Catchers to Exploit, Avoid When Chasing Steals

The article identifies pitchers, with more than 100 IP the last two seasons, that are most/least successfully stolen on (both a measure of frequency of steals and successful steal attempts).  The article then goes on to identify catchers with over 1,000 innings caught the last three years and the highest/lowest caught stealing percentages.

I like the applicability of this in both season-long rotisserie leagues allowing daily transactions and weekly head-to-head rotisserie leagues.  I’m not suggesting it’s necessary to check this list daily and start “streaming” base stealers against pitchers, but I see it as a way to squeak out a few extra steals over the course of the season or in a weekly head-to-head match up.

You can look up 2013 stolen base and caught stealing data by catchers on Fangraphs here or at Baseball Reference here.  And the stolen bases attempted and allowed by pitchers on Fangraphs here or at Baseball Reference here (Baseball Reference has information on stolen bases and caught stealing by pitcher, I can only find stolen bases on Fangraphs).

As an example of how to implement this, let’s say you have a decent base stealer on your team but on a typical day he doesn’t crack your starting line up.  He’s mostly sitting on the bench for depth.  But then you notice he’s got a match up against Edinson Volquez (7 SB allowed in 25 IP) and Nick Hundley (14 SB allowed in 19 G).  You can put your base stealer in the lineup and take out someone facing a difficult opposing pitcher.  Or vice versa, if you have a  stolen base specialist that usually is in the lineup, but is going against Johnny Cueto (whom Talley shows as the hardest pitcher to run in by a long shot), maybe you consider taking him out for the night and putting in a bench player with a game in Coors Field.

Updated tables for the current season, through April 29th, are below.

Want more tips and strategy advice like this?  Please click the follow button below.  Make smart choices.

Rk Player Tm G Inn SB ▾ CS CS%
1 Roberto Hernandez TBR 5 30.2 7 0 0%
2 Edinson Volquez SDP 5 25.1 7 1 13%
3 Clay Buchholz BOS 5 37.2 6 0 0%
4 A.J. Burnett PIT 6 35.0 6 0 0%
5 Cole Hamels PHI 6 37.2 6 2 25%
6 David Price TBR 6 38.0 6 2 25%
7 Chris Resop OAK 13 11.0 6 0 0%
8 Scott Feldman CHC 4 20.2 5 0 0%
9 Brad Peacock HOU 5 21.1 5 0 0%
10 Julio Teheran ATL 4 23.0 5 0 0%
11 Blake Beavan SEA 6 18.1 4 1 20%
12 Joe Blanton LAA 5 26.2 4 0 0%
13 Edwin Jackson CHC 5 28.1 4 0 0%
14 Tim Lincecum SFG 5 29.2 4 0 0%
15 Zach McAllister CLE 4 23.0 4 0 0%
16 Chris Sale CHW 5 33.0 4 0 0%
17 Evan Scribner OAK 8 12.2 4 0 0%
18 Jamey Wright TBR 10 10.1 4 0 0%
19 Dylan Axelrod CHW 5 27.1 3 3 50%
20 Josh Beckett LAD 5 30.1 3 1 25%
Provided by Baseball-Reference.com: View Original Table
Generated 4/29/2013.
Rk Tm G Inn SB ▾ CS CS%
1 Tyler Flowers CHW 20 170.0 16 3 16%
2 J.P. Arencibia TOR 22 191.0 15 2 12%
3 Welington Castillo CHC 19 163.0 14 7 33%
4 Nick Hundley SDP 19 166.1 14 4 22%
5 Chris Iannetta LAA 20 171.1 13 1 7%
6 Jose Molina TBR 19 129.1 13 4 24%
7 Carlos Santana CLE 15 123.1 13 2 13%
8 Alex Avila DET 17 151.2 12 4 25%
9 Jason Castro HOU 20 162.2 12 3 20%
10 John Jaso OAK 16 127.0 11 2 15%
11 Russell Martin PIT 22 178.0 11 6 35%
12 Buster Posey SFG 22 179.2 11 5 31%
13 Jarrod Saltalamacchia BOS 17 144.0 11 0 0%
14 Gerald Laird ATL 8 69.0 10 1 9%
15 Jose Lobaton TBR 13 89.1 10 1 9%
16 Jesus Montero SEA 14 128.1 10 0 0%
17 A.J. Ellis LAD 19 167.2 9 8 47%
18 Salvador Perez KCR 21 174.2 9 3 25%
19 John Buck NYM 22 178.2 8 5 38%
20 Erik Kratz PHI 21 161.1 8 4 33%
21 Yadier Molina STL 23 209.1 8 3 27%
22 Dioner Navarro CHC 6 50.0 8 3 27%
23 Derek Norris OAK 14 104.0 7 0 0%
24 David Ross BOS 9 79.0 7 3 30%
25 Kurt Suzuki WSN 19 159.0 7 2 22%
Provided by Baseball-Reference.com: View Original Table
Generated 4/29/2013.

Long-Term Thinking – Being Two Steps Ahead of Your League

Just as there will always be people searching for panacea weight loss pills, there will always be fantasy baseball players looking for simple fixes.  Some will fall victim to the hype machine (picking up every minor league call up with an iota of name recognition) and others will chase stats (picking up the bench player that hit three home runs last week, or my favorite, picking up a random long reliever that lucked into a save the night before due to pitching several innings in a blow out win).

And just as a long-term weight loss plan based on the fundamentals of exercise and diet is more likely to be successful than a pill, fact-based fantasy research and long-term thinking will be more successful than pursuing the flavor of the week.

Even better is a fantasy approach that will allow you to identify the “future flavors of the week” and pick them up before others even think to.  There’s nothing worse than having worked hard to stock your team’s “Watch List” only to be outraced by vulture league mates with Twitter access and quick trigger fingers.

Stacking The Odds In Your Favor

I prefaced this article with a discussion of the vultures.  But it’s not just the vultures you’re up against.  You probably have two or three other managers in your league that think similarly to you and value players consistent with you.

You’re in a competition for talent with 11 other managers.  Some skilled.  Some not.  It makes a great deal of sense to set your horizon of identifying future impact players just a bit further than everyone else in your league.

“Who will Be The Hot Pickup Next Week?”

This is the line of thinking to use.  I prefer this proactive approach in determining which player to pick up (who will be playing effectively in the near future) to a reactive approach (who was hot last week or who are the fantasy experts currently telling everyone to pick up).

How Do I Switch to This Proactive Approach?

To a large extent, reading and consuming fantasy baseball advice will lead to reactionary behavior.  While consuming this fantasy advice is a very valuable thing to do, in terms of valuing players and being aware of what others are likely reading or listening to, it usually involves news about what happened yesterday.  It is news about who is hot, who is cold, whose fastball has lost velocity, who got called up to the majors, etc.  It is updated rankings, it is “who would you rather have”.

You can see how the focus is on the past or present.  Again, some of this is good to know.  It can help your team.  It helps you know what others are thinking.  But to create an advantage, attempt to shift your focus to the future.

My recommendation is a simple one – Be very up-to-date on your major league baseball news.  Not your fantasy news.  Your MLB news.  Events in major league baseball are the driving force behind changes in opportunity and surroundings for players.

Baseball news precedes and drives fantasy news.

It’s pretty straightforward.  A team beat writer is going to get the news about a player losing his spot in the lineup before a fantasy writer.  The beat story might come out the night of the 21st.  That story has to reach the fantasy community who will then Tweet about it later that night.  They’ll then write columns about it on the 22nd, the next day.  And then on the 24th they might include the news item and some analysis in a weekly podcast.

And all the while, you could have received the news yourself and intelligently analyzed the fantasy impact.

Sources For MLB News

I get nearly all of my MLB news from two locations – Twitter and Buster Olney.

I follow a handful of MLB writers and then at least one beat writer from each MLB team.  To save you the trouble of identifying 30 beat writers and following them, you can check out the Smart Fantasy Baseball MLB News / Writers Twitter list (for more on Twitter lists and how to use them, read this).

I don’t necessarily read every tweet from each beat writer, but a few nights a week I might find myself scrolling threw the feed.  It would a waste of time to read everything…

That’s a big reason why I try to read Buster Olney’s (follow Buster on Twitter) daily column when I can (here’s a link to his blog at ESPN, you do need to be an ESPN insider to read it).  His daily column starts out with a feature story from the world of baseball.  And then he launches into a series of quick hitters about injured players, moves & deals, the previous day’s games, and then a series of articles for each division in baseball.  Each bullet has a link to a story on the web.  It’s great.  It’s efficient.  You can scan through the whole thing in a couple of minutes.

What You’re Really Doing

A player’s skills are not going to change dramatically in a short period of time.  So we’re really trying to identify changes in opportunity (playing time) and surroundings (new teams if traded, new spot in the lineup, etc.) for players.

Conclusion

Paying close attention to general baseball news can help shift your focus to a more proactive approach in identifying players to roster.  This will allow you to make moves before your leaguemates and lead to more well-thought, long-term, strategic decisions.

Thanks for reading.  Get Smart.


Economic Theory and a Major Mistake to Avoid

Let’s get nerdy and mix economic supply and demand theory with fantasy baseball. While not an economics expert, I think the “supply” part of the fantasy baseball equation can be thought of in two ways:

  1. An individual player – in which case the supply is fixed, there is just one player
  2. All of the players in the player pool (where the player pool could be all players, all second basemen, etc.) – in which case the supply can fluctuate as rookies enter into the player pool, players get hurt, players switch from the AL to the NL if you play in AL- or NL-only leagues

Let’s think about things from bullet 1, an individual player perspective, and apply this part of the supply and demand model:

If demand increases, a shortage occurs, leading to a higher equilibrium price.  If demand decreases, a shortage occurs, leading to a lower equilibrium price.

The statements above can be modeled with this graph below:

Supply-demand-P


Delving into a brief economics lesson, the price of a product (or player) is set at the point where the demand curve (red downward sloping curve) meets the supply curve (teal upward sloping curve).   In the picture above, the D1 demand curve crosses the S supply curve at the price of P1.

An increase in demand is illustrated by the red D1 curve shifting to the right to become the D2 curve.  Under this scenario, D2 crosses the S supply curve at the higher price of P2.

I Love the Colored Picture, But What Does This Have To Do With Fantasy Baseball?

I’m surely not considering everything that can affect a player’s demand, but I’ll group demand shifts into two categories:

  1. Real, factual, supported on-field events
  2. Artificial, unfounded, unsupported changes in demand

The first category would include events that truly do support a change in the demand of a player.  This would be things like a player getting injured (and decreasing demand), a minor league player getting called to the majors (and increasing demand), a player showing improved abilities and hitting/pitching better than expected (and increasing demand), a player performing worse than expected (and decreasing demand), or a player moving to a more favorable environment that should help their production (and increasing demand).

These events are real.  They can be measured to some extent.  We can see when players improve their skills, get more opportunity to play, or change their surroundings.

Because these are real and measurable, a change in the demand and valuation of a player makes sense.

But Many Changes in Valuation Are Not Founded

A major mistake I see from fantasy baseball players is to make adjustments in demand that are not related to these real measurable events.  Some examples:

  • Rookies and other young players are perceived as “cool” or “sexy”, and there is an artificial shift in their demand curves to the right because of this.
  • Older and aging players are perceived as the opposite, and there is an artificial shift in their demand curves to the left because of this.
  • A player gets pegged as a “sleeper” by the fantasy community, this takes on a life of its own, and causes a shift in the player’s demand curve to the right.

How To Take Advantage of These Situations

This definitely occurs.  There’s not a doubt in my mind.  It’s up to you to recognize when this is happening and sell or avoid players that are overvalued because of artificial shifts in demand, and when to buy or seek out players that are undervalued.

Current Examples Leading to mis-Valued Players

  • Mike Trout – He certainly had a magical season last year.  But do you know that he played two and half seasons in the minors and didn’t hit 30 home runs COMBINED in those three years?  He did hit 30 in his first major league season, but it seems like a bad idea to expect that again.
  • Mike Zunino – He’s being talked about like he’s the next great offensive catcher.  Who is the last young catcher to come into the major leagues and succeed?  I can’t name one.  
  • Paul Konerko – He’s the poster boy of the old, unsexy, but still very productive player.  Nobody wants Paul Konerko on their team.  BORING!  Well, do me a favor and go look at his career stat page.  He’s a machine.   And he was only the 18th ranked first basemen heading into the season.

You get the idea.  There are many more examples out there.  And the line between supported and unfounded changes in demand is gray and blurry.

The hot new trend in fantasy baseball analysis is to quote a pitcher’s velocity as if it is the determining factor in their success.  A few weeks into the season news has surfaced that C.C. Sabathia, Justin Verlander, and David Price are suffering from lost velocity.

On the surface, this sounds terrible.  And while the decrease in velocity is a measurable fact, it doesn’t necessarily indicate a loss in effectiveness.  After C.C. Sabathia’s first start, it was widely quoted that his fastball was several MPH slower than it was in 2012.    His career was over.  He was old.  He would never be the same.  In his next two starts he went out and threw 15 IP, allowed only one earned run, and struck out 13.

More pitchers facing lost velocity in early-2013: Matt Moore (29 strikeouts in 26 IP), Lance Lynn (34 strikeouts in 29 IP), and Max Scherzer (36 strikeouts in 24 IP).

Conclusion

Recognize when and why a change in demand has occurred.  You hear a lot of “buzz” about a player.  A player is being talked about on Sportscenter.  You hear someone say a “player’s career is over”.  Do the opposite of what the crowd is doing and you’ll come out ahead in the long run.

Thanks.  Stay smart.