***UPDATED for the 2026 Season***
If you are looking for a faster way to calculate custom player rankings and dollar values using standings gain points, this is the Excel tool for you.
What is the Automated SGP Ranking Excel Tool?
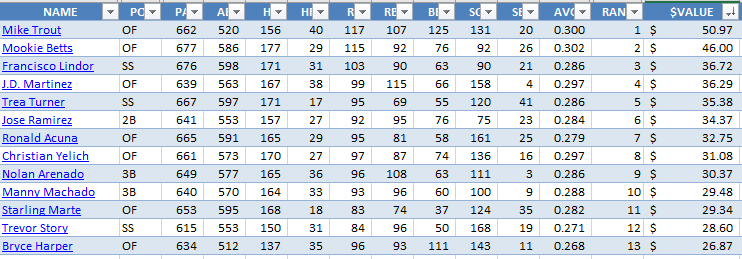
The Automated SGP Ranking Excel Tool can calculate standings gains point rankings and dollar values in minutes for just about any Excel-based projection set you can throw its way. You simply download the projections of your liking, move the projections data into the Automated SGP Ranking Excel Tool, and fill out information about your league settings. Customized SGP rankings and dollar values are calculated instantly.
Don’t agree with the projections for a player? Simply change his projection. His ranking and dollar value will change instantly, along with those of all other players. The Excel tool automatically makes all necessary SGP calculations, determines replacement level, and does so in accordance with all of your league rules and your desired valuation preferences.
Here’s a two-minute video highlighting how the Automated SGP Rankings Tool works:
Looking for the fastest way to customize rankings and dollar values for your own league and favorite projection set? Click the “Buy Now” button to purchase the Automated SGP Ranking Excel Tool for $17.99.
Why Do I Need Custom Dollar Values and Rankings?
I’m a firm believer that the biggest step a fantasy owner can take toward improvement and winning championships is to begin working with tailored projections and calculating custom dollar values and rankings specific to their league. The Automated SGP Ranking Excel Tool allows for this. It breaks down the huge barriers of learning complicated Excel formulas and strategies to develop customized rankings. You really just have to load in your favorite projections (which you can then customize), adjust a list of settings, and the calculations happen automatically.
You can adjust projections to fit your beliefs about players and their valuations and rankings update immediately. This allows you to focus on adjusting projections and playing time estimates. You then get objective and official updates to your rankings. No guesswork. No subjective sliding players around the rankings.
How Does it Work?
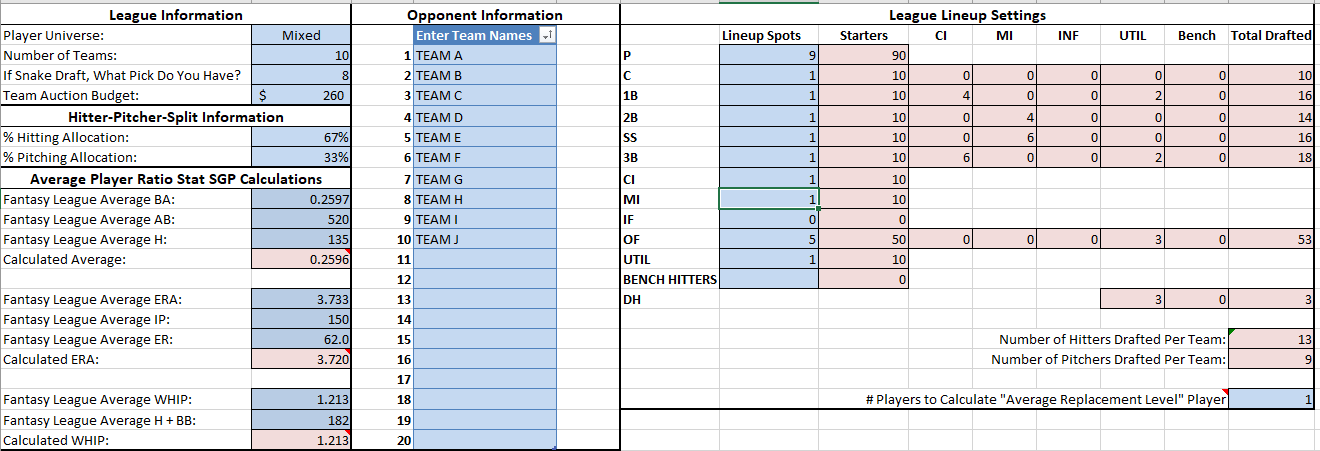
The Excel tool relies heavily on the Player ID Map (click here to see the Player ID Map) and Excel formulas to locate each player from the projection set you’ve loaded. It then processes all the information you’ve provided about your league’s settings to calculate the standings gain points for each player. It is preloaded with formulas that automatically determine who replacement players are for your league size and roster settings. The Excel tool then calculates each player’s “SGP over Replacement Level” and determines the dollar value and ranking to be assigned.
What Categories Does this Work With?
The Excel tool currently works with the following rotisserie categories:
| Hitting Categories | Pitching Categories |
|---|---|
| Runs (R) | Wins (W) |
| Home Runs (HR) | Saves (SV) |
| Runs Batted In (RBI) | Strikeouts (K) |
| Stolen Bases (SB) | Earned Run Average (ERA) |
| Batting Average (BA) | Walks + Hits per Inning Pitched (WHIP) |
| On Base Percentage (OBP) | Quality Starts (QS) |
| Slugging Percentage (SLG) | Holds (HD) |
| On Base Plus Slugging (OPS) | Saves + Holds (SV+HD) |
| Strikeouts (SO) | Innings Pitched (IP) |
What League Types Will this Work for?
The Excel tool will work with the following league types:
- Mixed league, AL-only, and NL-only
- League sizes from 6 – 20 teams
- Pretty much any configuration of C, 1B, 2B, SS, 3B, CI, MI, IF, OF, and UTIL/DH
Note, all pitchers are treated as one position in the Excel tool. I’ve found that there isn’t much reason to change values for SP and RP positions in most league configurations and it’s a daunting task to incorporate statistics for games pitched as a starter or reliever.
What Other Features Does this Spreadsheet Have?
The immediate and automatic ranking of players is the most significant feature of this tool, but it comes with a handful of other helpful features too.
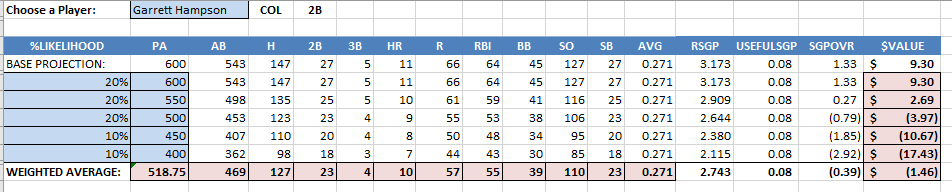
Multi-scenario Value Calculator
Includes a tab to run values for multiple scenarios relating to a player. You can enter the likelihood of a scenario and the playing time estimate you want associated with that scenario. Values are calculated for each possibility, as well as a weighted average for all scenarios combined. This is an excellent way to view the “ceiling” and “floor” for players with uncertain playing time.
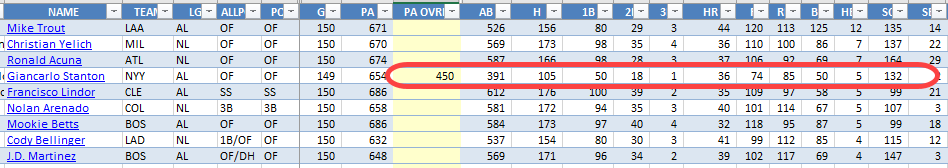
Ability to Override a Playing Time Projection
Thinking you can project rate stats better than a well-known projection system is misguided. But you very well may be able to project playing time better. The Excel tool allows you to override the playing time projection for any player and have all counting statistics and dollar values update immediately for the change. Don’t think Giancarlo Stanton is good for 600 PAs? Knock them down.
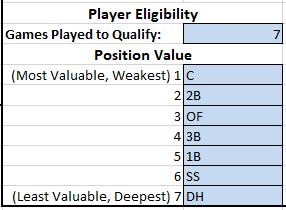
Customizable Position Eligibility Rules
The shortened 2020 season meant the traditional 20-game eligibility threshold players had to reach to qualify at a defensive position was out the window. Given that eligibility rules vary (5, 10, 20 games), the Excel tool now allows you to specify your league’s rule and to provide the position assignment priority. Those doing customized rankings have historically assigned positions in an order like C, SS, 2B, 3B, 1B, and OF. That ordering has shifted in recent seasons as it seems SS has become the most skilled and deepest offensive position and OF has become overrun by platoons. The tool now defaults to C, 2B, OF, 3B, 1B, and SS, but you can enter your own ordering.
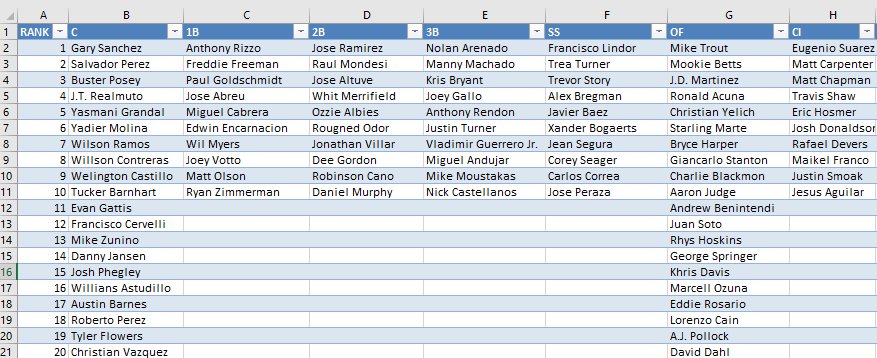
Built-In Position Rankings Cheat Sheet
Rankings are also automatically converted into ranked cheat sheets by position
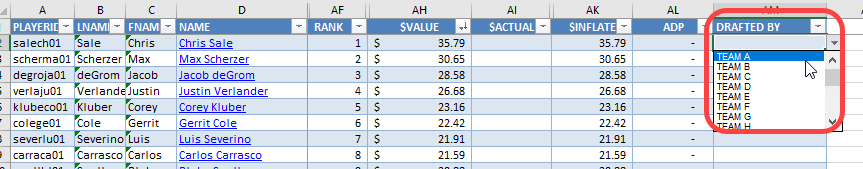
Use During a Draft to Track Selected Players
If you’re quick with your computer, you can also use the Excel tool to track the teams players are drafted by.
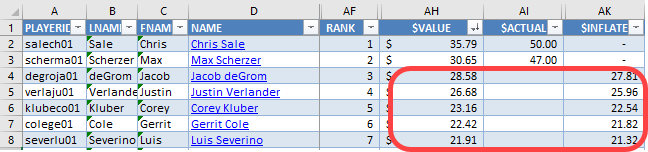
Automatically Calculate Keeper or In-Draft Inflation
Whether it’s bargain keeper contracts or overpayment during the draft, prices are adjusted accordingly for the exact amount of remaining budgets. You can compare the original price players were calculated at to the inflation-adjusted prices.
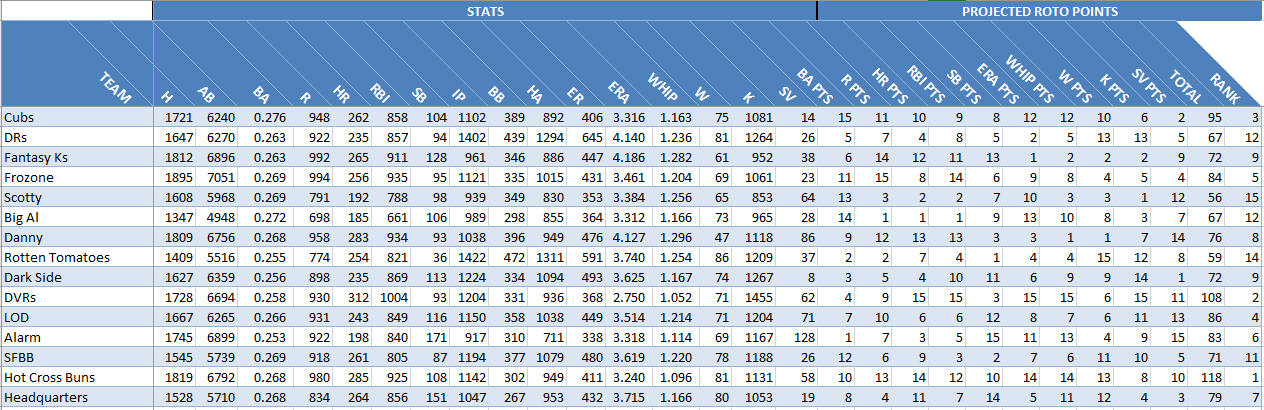
See Projected Standings for Your League
As players are assigned to teams, projected standings are instantly calculated. See where you stand or monitor your team’s targeted statistics levels during the draft.
How Hard is it to Setup?
If you haven’t yet, take the time to watch the two-minute video above. The hardest part of the setup is the downloading of your favorite projection set. After that, you simply move those Excel-based projections into the Tool and adjust several settings in the Automated SGP Rankings Tool. You can have custom rankings within minutes. It’s so easy, you can update projections multiple times during draft season as players shuffle around and news becomes available.
What Do I Need for this to Work?
I recommend that you have at least Microsoft Excel 2010 or greater for Windows or PC. The more recent your version of Excel, the better.
Updates For the 2026 Season
Your purchase includes any updates or bug fixes I make during the 2026 season. Please be sure to register for the update e-mails immediately after your purchase.
No Risk Money-back Guarantee
If you’re not completely satisfied with the Automated SGP Rankings Tool, I’ll refund your purchase.
Please Click the “Buy Now” Button Below to Purchase the Excel Tool for $17.99
I firmly believe that using rankings and dollar values customized for your league is the biggest single step you can make toward improving at fantasy baseball. This tool is the simplest and fastest way toward making that leap.