Glossary

My interpretation and summary of advanced baseball or sabermetric statistics to be used at making yourself a smarter fantasy baseball player.

A Deep Look Into Hitter Strikeout Rate (K%)

A Deep Look Into Hitter Strikeout Rate (K%)

Read any fantasy baseball analysis and you’re bound to encounter the hitter strikeout rate (or K-percentage) statistic.  “Player A’s strikeout rate has increased from 18% last year to 22% so far this year”.  I understand K-percentage is, it’s not complicated to calculate.  But I’ve never been able to locate a good explanation of why strikeout rate is inherently bad or what it indicates.  So I set out to answer some of these questions.

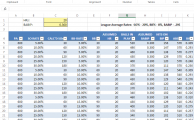
My goal in this post is to take a deep look into what strikeout rate is and what effect it has on batting average.  If you’re not much for reading, skip to the spreadsheet illustrating the effect of strikeout rate on batting average.

What Is Strikeout Rate?

This is simply the percentage of plate appearances that result in a strikeout.  Fangraphs has a good, brief discussion of the statistic and what represents an Awful-to-Excellent rate.

Strikeout Rate = Strikeouts / Plate Appearances

What Does This Mean? Why Do We Care?

After quite a bit of scouring the internet, I am still unable to locate anything more than the basic definition of the term strikeout rate (if you know of a great explanation, please leave a comment or Tweet me the link).  The Fangraphs article mentions the more a player strikes out, the more difficult it is to maintain a high batting average, but it’s short on specifics.  I found a nice article at Beyond the Box Score about how to predict strikeout rate.  But that seems like a pointless exercise until I understand more about the statistic (why predict something I don’t fully understand!).

Since I can’t find a great resource, I’m left to speculate and make an educated guess.  It’s pretty clear that a strikeout is a missed opportunity to put the ball in play.  It’s certainly an out.  So it inherently is detrimental to a players batting average (the ball is not put into play, so the AB cannot result in a hit).  Further, it can’t lead to a run, HR, or RBI.

While we know it’s bad for batting average, it’s very important to keep in mind that there is also a trade off.  Watch enough baseball and you know that striking out is related to power.  And it’s been proven that this is the case.  So we know that striking out negatively affects batting average, but it is positively related to hitting for power.  Meaning there’s likely some point at which you could optimize a hitters ability to hit for average and still hit for power.  That seems like a different article for a different day.

The Effect On Batting Average

How much does strikeout rate affect batting average?   (more…)

What is Regression Toward the Mean?

Read an article about baseball analysis or listen to a sabermetrically slanted podcast and you’re bound to come across the term “regression toward the mean” or a remark that “player X’s BABIP is bound to regress”.  But what exactly does this mean?  For God’s sake, the last statistics class I took was my sophomore year in college.  Even the least technical baseball analysts throw this phrase around like it’s common knowledge.

A Practical Example

Generally speaking, the average BABIP in Major League Baseball is in the neighborhood of .300.  There are a variety of factors that can influence a player’s BABIP to be higher or lower than that mark, but disregard that for this simple example.  For this next discussion let’s assume that just like the odds of a coin being flipped heads are .500, for the odds that any ball batted into play will result in a hit are .300.

So in this example world, if we took a group of 100 fantasy baseball hitters and let them play out an entire season, we would expect the BABIP for each individual, and for the group, to be .300.  Just like flipping a coin 100 times won’t always results in 50 heads and 50 tails, we realize that some players will have a BABIP much greater than .300 and others will fall greatly below .300.  Those with BABIPs over .300 will have benefited from luck, while those under .300 experienced bad luck.

Now assume the players were split into two groups.  One group of the 50 highest BABIPs in our fake world.  And the other group of the 50 lowest BABIPs.

Because every batted ball has a three-in-ten chance of being a hit (.300), even for the group of the 50 highest BABIPs we would still expect their batting average on balls in play to be .300 in the second season.  Likewise for the hitters with the lowest BABIPs.  Even though they had a low BABIP in the first year of our experiment, we would still expect a BABIP of .300 in the second year.

That’s What Regression Towards The Mean Is

Despite an above average performance in the past, you would still expect the player to have a .300 BABIP in the second year.  You expect their BABIP TO REGRESS TOWARD THE MEAN of .300.

The term regression applies to both those that outperformed in the past and those that underperformed.  A player with a BABIP of .250 in the first year of the experiment would be expected to “regress” toward the mean of .300.

Don’t Make a Huge Mistake

A common mistake is to assume that someone who has been lucky in the past will “punished” or experience bad luck in the future.  THIS IS NOT TRUE.  If you flipped a coin 10 times and it landed on heads all 10 of those flips, you would still expect five heads on your next 10 flips.  You would not expect zero heads or 10 tails.

If a player gets off to a “hot” or “lucky” start, you can expect them to “cool off” (or regress toward the mean).  But it would be a mistake to believe they will become “cold” or “unlucky”.  You should expect them to move toward their “average” or “expected” level.

Shall We Play A Game?

At the time of writing, Carlos Gomez’s BABIP is .421.  Assuming our simple world where every player is expected to have a BABIP of .300, what would “should” Gomez’s BABIP be at the end of the season?

A.  Something greater than .300

B.  .300

C.  Something below .300

The correct answer is….  A!  Let’s take a look.

To this point Gomez has a .421 BABIP based on 45 hits on balls in play and 107 total balls batted into play (45 / 107 = .42056).

Gomez has played in 39 games.  So we’re roughly 25% into the season.  Going through a very rough calculation, we would then assume through the next 120 games Gomez will put the ball into play 321 times (107 through roughly 40 games * 3 = 321 balls put into play for 120 games).

And if we assume a .300 BABIP on those 321 balls put into play, that calculates out to 96 hits on balls in play (.300 * .321 = 96).

For the season we have:

45 + 96 = 141 hits on balls in play

107 + 321 = 428 total balls put into play

141 / 428 = .330 BABIP for the season

Those 45 hits on balls in play are already “in the bag”. They cannot be taken away. So the end result should be a BABIP over .300 for the season.

Apply This Elsewhere, With Caution

Regression towards the mean can be applied to other statistics.  You must be careful to apply it only to statistics that are not significantly affected by skill.  For instance, good pitchers with good fastballs and “stuff” and deception and good control are simply going to strike out more batters than bad pitchers with poor control and limited ability.  It would be a mistake to expect a skilled pitcher’s strikeout rate to regress toward the league average.

Statistics like pitcher home run per fly ball, line drive percentage, and left-on-base percentage tend to fall in predictable ranges.  Extreme deviations from average are likely due to regress.

Realize THAT WE DON’T LIVE IN A SIMPLE WORLD

It’s very important to realize that we don’t live in a simple world.  Especially as it applies to baseball.  To some extent, all statistics in baseball can be influenced by the player’s skill level.

While nobody has been able to consistently flip heads on a coin 60% of the time, certain players have been able to consistently achieve BABIPs higher than .300.  We know faster players can achieve higher BABIPs.  But slow players have done this too.  Some pitchers can consistently control home runs per fly ball.  Some hitters consistently hit line drives.

The Take Away

It’s important to understand the concept of regression and to know the common pitfalls in applying the principles.  At the very least you can use this knowledge to identify “experts” that need to revisit their college statistics text book.

Make smart choices.

Understanding DIPS and FIP

Defense Independent Pitching Statistics (DIPS)

“There is little if any difference among major-league pitchers in their ability to prevent hits on balls hit in the field of play.” – Voros McCracken, Pitching and Defense

McCracken’s article mentioned above was extremely influential in pioneering a new wave of baseball statistics.  McCracken began the process of separating pitching statistics from the defensive players behind the pitcher.  The question being, “Can we measure the effectiveness of a pitcher by using statistics that only a pitcher can control?”.

In attempting to answer this question, McCracken created Defense Independent Pitching Statistics, or “DIPS”.  A key finding in McCracken’s work is that a pitcher’s walk rate, strikeout rate, and home run rates were somewhat consistent from year-to-year, while BABIP was not.

If a player can consistently maintain walk rates, strikeout rates, and home run rates, any fluctuation in statistics like ERA or BABIP must be influenced by defense and luck, which are factors outside a pitcher’s control.

With this in mind, let’s examine the five possible outcomes for a given pitcher vs. batter plate appearance:

  1. Ball hit into play for a hit
  2. Ball hit into play for an out
  3. Home run
  4. Strike out
  5. Walk (or HBP)

Of these categories, items one and two are clearly dependent upon defensive players and luck (is the frozen rope hit directly at the third basemen or six inches out of his reach?).  Items three, four and five are completely independent of defensive players.  And while some luck is involved in home run rate, the pitcher’s skill is a factor as well (some pitchers give up a lot of home runs, some can prevent them).

That’s where FIP comes in.  No not that FIP.  This one.

Fielding Independent Pitching (FIP)

FIP, developed by Tom Tango, attempts to evaluate pitchers only on factors under their control.  Or independent of fielding.  Tango’s calculation uses the measures that are significantly within a pitcher’s control (HR, BB, K) to approximate what the pitcher’s ERA “should” be.  FIP is an easy stat to use and calculate because it has a simple calculation:

FIP = (13 * HR + 3 * BB – 2 * K) / IP + 3.20

The addition of 3.20 is to more closely align FIP with ERA.  Otherwise you end up with numbers like 0.50 or 0.77.

FIP turns out to be an incredible predictor of ERA (check out this analysis of the top 10 ERA and FIP leaders since 1962 by Tom Tango).

Is FIP Always an Accurate Measure of ERA?

No.  In an individual season, ERA and FIP can differ significantly (up to 1.00).  Further, some pitchers display a perpetual difference between ERA and FIP.  For example, Zack Greinke has a career ERA of 3.77 and a career FIP of 3.45 (his actual results are worse than expected).  While Mark Buehrle has a career ERA of 3.82 and a career FIP of 4.14 (better than expected).

A significant difference between ERA and FIP over the course of a lengthy career suggests other factors at play that FIP does not account for.  Perhaps there is some intangible quality that Grienke does not possess that leads him to have an ERA greater than his FIP.  Maybe Mark Buehrle has this quality and it allows him to regularly outperform his FIP projections.

How Do I Apply FIP to Fantasy Baseball?

Granted, this Harball Times article is from 2005.  But the results are impressive.  Of the 22 pitchers whose ERA exceeded their FIP the most, 18 saw their ERA decline the next year (and two didn’t even play!).  Of the 30 whose ERA was lower than FIP, 23 saw their actual ERA increase.  Applying this, we can look for pitchers whose FIP varied greatly from actual ERA to identify candidates likely to improve upon last year’s ERA or to identify those likely due for an increase in ERA.

What Do You Think?

Please leave your comments below.  Have you added FIP to your repertoire yet?

Thanks for reading.


FURTHER READING

Tom Tango, the creator of FIP, is also well known for The Book: Playing the Percentages in Baseball. This is recommended reading if you’re looking to understand optimal baseball strategy.

RESOURCES

xBABIP? Let’s Start Putting Random Letters in Front of Statistics!

In our discussion of BABIP, we mentioned that it’s frequently misused or misinterpreted.  An example of its misuse might be, “Miguel Cabrera’s BABIP was .331 in 2012.  He’s due for a drop in production as we expect his BABIP comes back down to the league average of about .300″.  That’s where the “x” comes into xBABIP, or Expected Batting Average on Balls in Play.

What Do We Use xbabip for?

xBABIP is a projection of what a given player’s BABIP will/should be.  It’s not a measure of past performance like BABIP.  So we can use it to project a player’s statistics for the year.

Should we expect all hitters to have a BABIP of around .300?

No.  As you know, there are many different types of hitters.  Even without statistics to support the argument, you would probably expect a hitter with power to have a different BABIP than a hitter with little power.  You’d expect a hitter that tends to hit more ground balls and line drives to have a greater BABIP than a fly ball hitter (a fly ball that stays in play has a low chance of being a hit).

How Is xbabip calculated?

This is a difficult question to answer.  As far as I can tell, because this is a projection, there is no definitive calculation.  This article at the Hardball Times may be the first to reference the phrase “xBABIP”.

The harder I look for an agreed upon calculation, the more variations I find.  In my not-so-expert opinion, I see two ways to calculate without needing a degree in statistics:

  1. Use a player’s historical BABIP to project future BABIP
  2. Break down batted ball data into categories of ground balls, line drives, and fly balls (some will then further break fly balls into infield fly balls and outfield fly balls). (more…)

What the flip is BABIP?

Batting Average on Balls in Play, or BABIP, is a measure of a hitter’s batting average on batted balls that can be fielded (thus are “in play”).  It would include all ground balls, line drives, fly balls (including sacrifice flies), and fielded foul outs.  It does not include at bats where the batter strikes out or hits a home run (the ball is not put “in play” during these at bats).

For example, assume a player has 10 at bats.  Within those ten at bats the player strikes out three times and hits one home run.  That leaves six balls that were batted in play (10 at bats – 3 Ks – 1 HR = 6 balls in play).  Of those six balls in play, two were for hits and four were various outs (ground outs, fly outs, etc.).  In this example, the player’s BABIP would be .333 (2 hits / 6 balls in play).

The official formula for BABIP is:


BABIP = (H – HR) / (AB – K – HR + SF)

WHAT IS THIS STAT TRYING TO ACCOMPLISH?  WHAT DOES IT TELL ME?

On a very simplistic level, BABIP is a measure of a batter’s luck.  The theory is that a player’s skill contributes significantly to their contact rate (avoiding strike outs) and hitting for power (home runs), but there are other factors (like luck, which is beyond the hitter’s skill or control) that come into play when a ball is batted into play.

When a player hits a hard line drive they may be unlucky and have it hit directly at an opposing fielder.  Or a player may be lucky and hit a soft blooper over the infield.

Figure 1 below shows the BABIP for all hitters with at least 250 ABs for the last five years.  You can see that BABIP hovers consistently around the .300 – .305 mark.

Figure 1 – BABIP for All Hitters with >250 AB

ARE THERE ANY WEAKNESSES IN BABIP?

I think the main weakness is simply (more…)