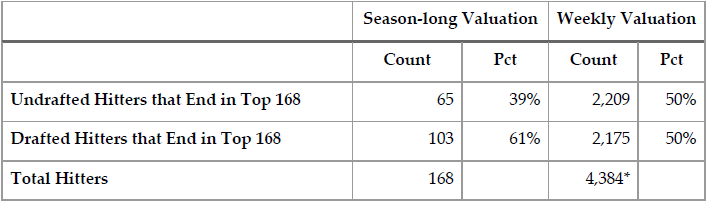
The SFBB Excel tools are updated and ready to help you prepare for the 2026 season! If you’re looking to build skills and develop your own methods for ranking and valuing players, these are for you!
| Title | Description |
|---|---|
 |
Automated SGP Ranking Excel Tool – $17.99 ***UPDATED for 2026*** The Automated SGP Ranking Tool will help you convert your favorite projection set (Steamer, The Bat, Razzball, RotoWire, PECOTA, etc.) into Excel-based rankings and dollar values tailored to your own league’s settings. The process takes only minutes. No messy Excel formulas. Just load your projections into the file, adjust a few settings, and standings gain points rankings are calculated automatically. Click here to read more about the tool.
|
 |
Automated Points League Ranking Excel Tool – $17.99 ***UPDATED for 2026*** Powered by the same concepts as the Automated SGP Ranking Tool, the Automated Points League Ranking Tool does all the same things, just for nearly any imaginable points league. The tool works with any popular projection set and allows you to enter your league’s unique point scoring system, then instantly converts those projections into tailored point totals and dollar values. The process take minutes and will give a huge advantage over owners that are not tailoring rankings specifically to the league scoring system. Click here to read more about the points league tool.
|
 |
Projection Aggregator – $9.99 ***UPDATED for 2026*** An easy-to-use Excel spreadsheet that can combine (or average) up to five different projection sets. The aggregator can use just about any well-known projection set you can find on the web (if you find one that doesn’t work, let me know!). Simply download your favorite projection sets, fill out some settings, and you’re done. No complicated formulas or VLOOKUPS for you to add.
|
 |
The Process – 2026 Edition ***UPDATED for 2026*** This year’s edition of The Process contains many exciting new updates, studies, standings, and SGP data. Visit thefantasybaseballprocess.com to read many more details. Appendix 2026 Edition (PDF) – $14.99 Click here to purchase the Appendix 2026 Edition in a PDF e-book format for $14.99. Full 2026 Edition (PDF) – $19.99 Click here to purchase the Full 2026 Edition in a PDF e-book format for $19.99. Appendix 2026 Edition (Paperback) – $17.99 The appendix is also available in paperback form on Amazon.com. Click here to purchase the appendix on Amazon for $17.99. Full 2026 Edition (Paperback) – $24.99 The full book is also available in paperback form on Amazon.com. Click here to purchase the book on Amazon for $24.99. |