Analysis

Does It Make Sense To Carry Three Catchers?

Does It Make Sense To Carry Three Catchers?

ThreeCatchers1
Yahoo! Games Played Tracker does a great job of projecting your games played by position

I play in a couple mixed leagues that use the standard rotisserie lineup configuration (if there is such a “standard” any longer) of 2 C, 1B, 3B, CI, 2B, SS, MI, 5 OF, and one UTIL/DH.  In these two catcher leagues, I perpetually leave games played on the table because no catcher plays 162 games in a season.  But in a league with games played limits, you’re given 324 games to be played by catchers during the season (162 games * 2 catchers).

ThreeCatchers2
2012 Catcher leaders in games played courtesy of Fangraphs. Click the image to view this information at Fangraphs.com.

If  you only carry two catchers all year, by the time you reach the end of the season you could easily be looking at coming up 60+ games short of the allotted 324.  To illustrate, look at the catcher leaders in games played for 2012 (Note:  these are not necessarily the top 24 fantasy catchers, just MLB games played leaders).

Some of the top fantasy options like Buster Posey and Joe Mauer play a lot of games (approaching 150).  But when you start to account for the fact that 24 catchers must be started in a 12-team two-catcher league, you can see how many games will be left on the table (many don’t even get to 120 games).  And each one of those games is a missed opportunity for counting stats like runs, home runs, and RBI.

I hate the idea of using a coveted bench spot to hold the 25th best catcher.  What kind of stat line does such a player have?  But missing out on 60-80 games played seems like a huge missed opportunity.  So let’s get to the bottom of this. (more…)

Max Scherzer Anecdotes and Analysis

Max Scherzer Anecdotes and Analysis

A couple weeks back the Detroit Tigers and the Texas Rangers squared off in ESPN’s Sunday Night Baseball .  You might recall this game because Miguel Cabrera went 4-4 with three home runs and five RBI, the first of four straight games with a HR.

During his time with the Tigers, Buster Olney sat down with Max Scherzer for an in-depth conversation.  Much of the discussion was included in the May 20th edition of the ESPN Baseball Tonight podcast that Olney produces each week day.

Link to ESPN: Baseball Tonight with Buster Olney podcastUS iTunes, App Store, iBookstore, and Mac App Store

In the conversation Olney asked Scherzer about his curveball and here’s what Max had to say:

I’ve been tinkering with the curveball since last year, the second half.  I’ve been trying to find a pitch that slows down everybody.  It’s 15 mph off my fastball.  I feel like everything else is kind of hard and it doesn’t change the hitters timing.  I was able to throw it but the consistency on it wasn’t quite where it needed to be…  By doing that it allows me to have a fourth pitch and a pitch that really slows down and disrupts the hitters timing.  That pitch by itself can help play up every other pitch that I have.

~ Max Scherzer on 5/20/13 Baseball Tonight Podcast

There are a number of very interesting things buried in the comments.  When hearing about Scherzer’s increased use of the curve ball, his ability to more effectively locate the pitch, and the timing problems it might create for hitters, I realized the opportunity to join these anecdotes with data analysis.  If the data supports these comments, we could be looking at a pitcher with the ability to take a gigantic step forward.

1.  I’ve Been Tinkering With The Curve Ball Since Last Year, The Second Half

This is true. In looking at Scherzer’s PITCH f/x data (more…)

Analysis + Anecdotal Evidence = Results

I’m a firm believer that a key to happiness and success in life is to find a level of balance.  A balance between work and life.  Between spending money and saving money.  Between eating healthy and eating ice cream smothered in hot fudge, whipped cream, and chocolate chips.  Life is a tight rope that we’re constantly walking on.  If you find yourself leaning too much in one direction, you’ll fall from the tight rope.

Finding Balance In BaseBall Analysis

If you’ve read Moneyball, done much reading about the current wave of Sabermetrics, or if you watch MLB Now (see video below) you’re aware of the ongoing debate between the believers in statistical analysis and the believers in scouting.

In reality, this battle is being waged only by a minority of folks vehemently against the use of analytics.  It seems that the majority of “analysis” believers understand the optimal strategy is a balance of both analysis and scouting.

A Similar Battle In Fantasy Baseball

We must fight a similar battle for balance in doing research for fantasy baseball.  News articles, baseball announcers, and even main stream fantasy baseball publications will frequently sprinkle anecdotal evidence into their analysis.  Player A is “in the best shape of his life” (do a Twitter search for #BSOHL during spring training, you won’t be disappointed).  Player B has a new batting stance.  Player C is throwing a new pitch.

There is value to be found in some of these comments.  But the difficulty lies in how to identify the valuable information from the fool’s gold.

Changes In Process

As a frequent listener to the Towers of Power Fantasy Hour: The Baseball Prospectus Fantasy Podcast, Jason Collette frequently uses the phrase, “a change in process”.

Link to the Towers of Power podcast in iTunes:  US iTunes, App Store, iBookstore, and Mac App Store

On the MLB.com Fantasy 411 Podcast, Cory Schwartz frequently asks the questions, “what is different here” or “what has changed” (Schwartz usually acknowledges that he took this line of thinking from Jason Grey, but I can’t locate a resource in which Grey uses/shares this approach.  From what I can tell, Grey now works for the Rays and has a protected Twitter account.).

Link to the Fantasy 411 podcast in iTunes: US iTunes, App Store, iBookstore, and Mac App Store

This is the information to be looking for.  A new batting stance.  A new approach at the plate.  A new pitch.  A new delivery.  A new pitch mix.

Using Collette’s, Swartz, and Grey’s line of thinking, when a player changes the underlying process of their swing or their delivery, it is reasonable to expect a change in results.  Outside of such a change, changes in performance are likely just attributable random fluctuations in luck (and should regress toward the mean).

The Weakness in a Purely Analytical Approach

If you were to just use analytic tools to research player performance, you would likely miss some of these important changes.  You might realize a change in performance only to pass it off as an aberration of luck.  Or you might start to give statistical credence to a change significantly after the fact.

Analysis + Anecdotal Evidence = A perfect Marriage

The optimal strategy for fantasy baseball analysis is to find balance between statistical and anecdotal evidence.  You don’t need to follow up on every little tidbit you come across.  But train yourself to look for changes in a player’s process that might yield a change in their output.

 Recent Examples

To demonstrate that changes do happen and can lead to improved results, here are some examples:

Homework

As you read MLB news and watch games, be on the look out for information that might indicate a change in a player’s process.  Another reason why it pays to be knowledgeable about “baseball news”, and not just “fantasy news”.

Make smart choices.

I’ll Never Think the Same of Troy Tulowitzki

This recent article about Troy Tulowitzki, by Troy Renck of the Denver Post, is absolutely alarming.  I could have picked any of about six different frightening quotes from this great piece.  There are statements from Tulowitzki about how he is not physically capable of playing every day, how he still experiences shooting pain in his leg when lunging or overstriding, and that he must undergo two hours of pre- and postgame maintenance on his leg.

Perhaps the most hard-hitting line is from Renck,

“(Tulowitzki’s) career, if not the Rockies’ fortunes this season, hinge on how well Tulowitzki manages his surgically repaired left groin.”

If you havent’ already, I highly recommend reading the entire article at DenverPost.com.

My first thought after reading the piece was that of empathy for Tulowitzki.  I’m not a close fan of the Rockies, but I got the sense that this the first time he’s shared this level of detail on the health of his leg/groin.  You can tell it’s wearing on him.  It’s terribly sad that a player so skilled and with such potential has to walk this dangerous line.  And he’s only 28 years old!

My second thought, albeit very insensitive, was to apply the information to fantasy baseball.  I think it’s likely that I may never own Tulowitzki in a fantasy league again.  Or at least until there’s more concrete evidence that his groin and leg has fully healed to a pre-surgery level.  But there’s no indication from Troy Tulowitzki or Troy Renck that this will ever happen.

If anyone can recover through hard work and preparation, Tulo sounds like the man.

I absolutely love playing baseball, and there’s no amount of work I won’t do to prepare to play this game and help my team win. ~ Tulowitzki

But the risk seems too great.  And it’s a shame.

Be smart.

Running the Math on Early Season Batting Averages

Running the Math on Early Season Batting Averages

We’re now into May.  For the last month you’ve been beaten over the head with fantasy advice telling you to wait until at least May before making any significant moves.

You’ve exercised patience.  You haven’t made any brash decisions.  But maybe you’re still sitting with B.J. Upton (.149 BA), Ike Davis (.167), Will Middlebrooks (.193), Jose Bautista (.205), Edwin Encarnacion (.221), Matt Wieters (.224), or Martin Prado (.232) on your team.

Or maybe you’re me, with all of them…

RunTheMath
Unfortunately, they’re not really on the bench. I just ordered them this way to show them next to each other. Perhaps foolishly, I trot most of these guys out into my lineup every day.

But what do these batting averages mean?  How bad are they?  How far are they from being acceptable?  What would one good week do to a struggling player’s average?

I’m Glad You Asked

But first, let’s gain a little perspective.  I may have a fundamental flaw in the construction of this team, because with the exception of Prado, none of these guys could be expected to hit .300.  Here are their current year and career batting average and BABIP at the time of this article:

RunTheMath1
Current Year and Career BA and BABIP, Stats Courtesy of Fangraphs

From looking at the career BABIPs and their BABIPs to this point, it’s clear that each of these players has been “unlucky” to some degree (many of their BABIPs are 80 to 100 points below career levels).  

With that in mind, let’s play a simple game of “what if”.

What If Each of These Guys Had Five More Hits Since Opening Day?

As I mentioned above, we’re at about the 30 game mark for most teams.  We’re at the end of the fifth week.  What if, over the five weeks, each of these players had JUST ONE MORE HIT EACH WEEK?  I’m not asking for the world here.  Just one more hit each week, for a total of five more hits since opening day.

RunTheMath3
Scenario 1 – Each Player Has One More Hit Each Week of the Season So Far (five more hits)

Look at the column “BA w/ 5 More Hits”.  That looks a lot better, doesn’t it?  Most of the players see their average jump at least 50 points.  In fact, of the seven players listed, three of them (Bautista, Encarnacion, and Wieters) actually SURPASS their career batting averages under this scenario.  And four of the seven players reach the .250 mark (Bautista, Encarnacion, Wieters, and Prado).

Things are not as bad as they seem.

Yeah, But Those Five Hits Didn’t Happen…

You’re still skeptical?  I’d be seeing the glass as half-empty too if I had any of these batting average leaches on my team…  Oh wait.  I have them all.

But if you’re not sold on five bloop hits dropping in over the course of a month, let me propose another scenario.

What If Each Of These Guys Has A Good Week Starting Tomorrow?

And let’s keep it reasonable.  We’ll say they go 10-for-25 next week for a .400 batting average.   (more…)

Why I'm Not Buying Trevor Rosenthal (and Bought Mujica)

Why I’m Not Buying Trevor Rosenthal (and Bought Mujica)

Granted, Edward Mujica is probably owned in all leagues at this point, as he is now up to four clean saves.  But as recently as today, April 24th, a CBS update comes out saying Mujica “may not be a long-term solution”.  Mujica

Everything the update says is true.  But here are the reasons why I have invested in Mujica and why I think you should target him:

  1. He’s getting saves right now.  A bird in the hand is worth two in the bush.
  2. For his career, he has nearly a 5-1 strikeout-to-walk ratio.  
  3. Since joining the Cardinals* in 2012, he’s pitched 34.1 innings.  He has 29 strikeouts and four walks (over 7-1 strikeout-to-walk ratio).
  4. In those 34.1 innings, he has surrendered 2 home runs.
  5. *I realize this is an arbitrary point in time, and selecting arbitrary points in time can lead to misleading statistics.  But, it makes sense to do if there was a fundamental change in Edward Mujica after joining the Cardinals…  He’s not the same pitcher with the career 1.22 HR/9 ratio that detractors continue to bring up.  He has continually increased the use of his splitter the last few years.  And this great post at VivaElBirdos.com explains much more about Mujica’s increased usage of the pitch after coming to St. Louis.  Courtesy of BrooksBaseball.net‘s pitch data, here’s Mujica’s 2012 frequency by pitch type (notice the 45% splitters in the “Freq” column):
    Mujica1And here’s the data so far for 2013 (notice he’s only using three pitches now and using the splitter 59% of the time):
    Mujica2We’re still early in the season, but that’s a different pitch composition than in the past.
  6. There’s a lot of buzz about Trevor Rosenthal and his “stuff”.  His average fastball is 98mph.  He can hit 100 on the gun.  But between AA and AAA in 2012, he struck out 104 batters in 109 IP.  With all the talk about his dominating stuff, I would have figured he’d be over one strikeout per inning.
  7. I think the Cardinals have an incentive to keep Rosenthal in a middle relief role.  He can pitch multiple innings, if necessary.  He can still be converted into a starter, if necessary.  And with Jaime Garcia being at an elevated risk of injury (Garcia elects for rest and rehab instead), an additional starter may be needed.
  8. This is a bit of a long shot, but could be part of the equation.  Mujica is a free agent at the end of the 2013 season.  If he somehow walks away after earning 40 saves, he could be able to earn a nice contract.Under the new compensatory draft pick rules, if the Cardinals offer a contract of 1-year and $13.3 million (the 2012 threshold, amount will increase for 2013), and Mujica rejects the offer in order to become a free agent, the Cardinals get an extra draft pick.  And while it would be hard to imagine Mujica earning a contract worth more than $13.3 million in a single year, it wouldn’t be out of the realm of possibility to be offered a 3-year $20 million deal (Chris Perez makes $7.3MM, Jim Johnson $6.5MM, Brandon League signed a 3-year $22.5MM deal, Heath Bell a 3-year $27MM, Jeremy Affeldt has a 3-year $18MM deal).


Who are you buying or selling in the St. Louis bullpen?

Thanks for reading.  Stay smart.


Examining S.O.S. – Surroundings

Having discussed the overall Skills, Opportunity, and Surroundings approach to fantasy baseball decision making, and breaking down the “Opportunity” component, let’s now focus on “Surroundings”.

Be Honest…

When you were preparing for your fantasy baseball drafts, did you even look to see what spot in the lineup players would bat?

The Importance of Batting Order

You know that Mike Napoli, Salvador Perez, and Jonathan Lucroy are catchers.  But do you know that Napoli bat and Perez bat clean up and Perez and Lucroy hits fifth.  They hit in the heart of the lineup on pretty strong offensive teams.  Matt Weiters and Carlos Santana have batted sixth most frequently.  Wilin Rosario usually hits seventh.

(Thanks to MLB DepthCharts at Baseball Prospectus for the current lineup information.)

If you didn’t catch Smart Elsewhere #1, it’s a great read.  The article by Tristin H. Cockroft (follow Tristan on Twitter) contains great statistics about the additional at bats a player gets by batting higher in the order and the additional production a player contributes by batting in the heart of the order.  Understanding and applying these concepts will help you squeeze more value out of your drafts and in season pickups.

Cockroft’s article notes that, on average, a cleanup hitter gets about 0.30 plate appearances more per game than a seven hitter.

That’s almost 50 more times to the plate over the course of the season (162 games * 0.3  = 48.6).  Even if player X is not as skilled as a player Y, he might outproduce player Y if he comes to the plate 50 more times.

If we approximate that a full-time starter would have about 600 plate appearances, an increase in 50 plate appearances is an increase of 8.33% (50 / 600 = 8.33%).  And an increase in plate appearances should have a direct correlation with increases in counting stats like runs, home runs, and RBI.  An 80 run, 25 HR, 90 RBI player instantly becomes an 87 run, 27 HR, 97 RBI player.

Compounding Effect

My numbers above only account for the increase in plate appearances.  But there’s more to the story.  Comparing a seventh hitter to a cleanup hitter, there will be an increase in production for the cleanup hitter due to hitting near better offensive players.  A seventh hitter will get solid RBI opportunities due to batting with the fourth, fifth, or sixth hitters on base.  But that seventh hitter will be less likely to score runs due to having the eighth and ninth hitters hitting behind him.

Not only will a fourth hitter will see more plate appearances than a seventh hitter, those plate appearances will be in more productive situations because of the better hitters surrounding the cleanup hitter.

The Hard Numbers

Taking into account the additional plate appearances and the better surroundings, according to Cockroft’s findings, a cleanup hitter averages 0.839 Runs + RBI per game (the combined total of runs and RBI, so nearly one RBI or one R per game).  A seven hitter averages 0.652 Runs + RBI per game.  That difference is 0.187 R+RBI per game.  Over the course of a 162 game season, that is over 30 more Runs/RBI per game.

Other Components of “Surroundings”

Position in the batting order is a significant piece of the surroundings factor.  Others to consider are:

  • Lineup Strength – Cockroft’s article also gives specifics about the additional plate appearances and run production created by playing for a top offense as opposed to a poor offense.  A cleanup hitter for a top five offense can be expected to have 0.971 Runs + RBI per game; whereas a cleanup hitter for a bottom five offense can expect only 0.737 Runs + RBI per game.
  • Park Factors – Certain Major League parks allow for more run scoring than others.    The factors on this ESPN page show the 2012 park factors for run scoring.  I believe the phrase “park factor” can mean different things to different people, but for ESPN a factor of 1.000 would mean that a team would be expected to score the same amount of runs playing home games in a park as they would if they were playing on the road.
  • AL vs. NL – I haven’t found any hard data that gives specific details about the differences between the two leagues, but we know it’s easier for pitchers in the NL.  At the very least, facing a pitcher every 9 batters is a huge advantage.
  • Injuries – I decided to group injuries in the “Surroundings” category.  There’s an argument to be made that staying healthy is a skill (and belongs in the “Skills” category).  Or that being injured reduces your “Opportunity” to play.  But I view surroundings as outside forces that affect a player’s performance for the better or worse.  Being injured or being healthy certainly affect performance.  When you consider the scenario that players will play hurt but not miss time, I think raw “Skills” are not affected.  Rather, it’s an outside factor causing a drain on performance.
  • Contract Status – Whether or not you believe a player in a contract year will perform better than when not in a contract year, it’s still something to consider.  And contract status can also affect a player’s opportunity.  A team is likely to stick with a struggling $15 million /year player than they are to stick with a struggling player with remaining minor league options.

Conclusion

Monitoring where your hitters are hitting in the lineup and targeting those hitting high in the order is a great way to give your team a slight edge.  When you get to the end of a rotisserie season and it’s only several runs or several RBI separating teams in the standings, think about how every at bat counts along the way.

Be smart.


Examining S.O.S. – Opportunity

Now that we have broken down the S.O.S. methodology, let’s dive into a closer look at the components.  I’ll skip over the “Skills” component of S.O.S.  I know.  You’re thinking, “Wow, Tanner.  Create a new three part methodology and you skip right over the first part.”

Yes.  You caught me.  But a main idea behind S.O.S. is that we are always thinking about the “Skills” component and we’re missing the “Opportunity” and “Surroundings” pieces.

Opportunity Knocks

Looking over the S.O.S. equation…

OUTPUT = SURROUNDINGS * (SKILLS * OPPORTUNITY)

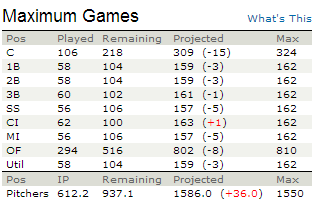
…  remember that “Skills” can be thought of as what a player would produce in 162 games (or 32 starts).

Because we start at 162 games or 32 starts, the “Opportunity” adjustment can only decrease the base projection.  To the extreme, if a player has no opportunity to play, their 162 game output is reduced to nothing (you may recall from elementary school math that multiplying 35 possible home runs by zero playing time calculates out to 0 actual home runs).

Identifying “Opportunity” Information

News about opportunity will not come from fantasy experts first.  Fantasy Experts are going to read or hear the information from a Major League Baseball writer (like Buster Olney, Ken Rosenthal, etc.) or a team’s beat writer.  And not all news about opportunity will be picked up on or analyzed by fantasy writers immediately.  With this in mind, if you’re looking for a way to get a small advantage over your competition, you should be in tune with not only fantasy news, but general MLB news.  Click here for information on how to easily follow MLB experts, fantasy experts, and sabermetricians on Twitter.

Case Study

Look at these recent news items about the Toronto Blue Jays (you don’t need to read the links, just the headlines):

Besides the direct impact these news items have on Wells’, Reyes’, Lawrie’s, Bautista’s, and Kawasaki’s value, the cumulative effect of these stories has a potentially very big impact on another player.

You have to dig a little bit here.  But it sure seems like Emilio Bonifacio’s playing time is under attack.  The Blue Jays base-stealing star shortstop, Reyes, goes down with an injury.  Rather than replace Reyes with Bonifacio, another base-stealer who has played 80 games played at SS in his career, they elect to go with the .192 hitting (in 104 AB in 2012) Kawasaki.

Not only that, but there is an effort being made to shift players, All-Star players, all over the diamond.  Lawrie to 2B, where Bonifacio had played more games (9 at the time of writing) than any other position (5 in OF), and Bautista to 3B.

So they’re going to move Bonifacio to the OF, right?  Perhaps, but the signing of Casper Wells, the presence of Colby Rasmus, Melky Cabrera, Rajai Davis and Mark DeRosa might make playing time scarce.  And none of the news articles even mention Anthony Gose in the minor leagues.

You aren’t going to see a fantasy analyst write a big article about Emilio Bonifacio’s playing time.  I did see quite a bit of buzz about Lawrie and Bautista picking up position eligibity and how it affects their value.  But nary a mention of Bonifacio.  The point being that the analysts aren’t going to catch everything.  There is still room for your own critical thinking to create an advantage for you.

*After I came up with this case study to illustrate my point, Casper Wells was designated for assignment, Jose Bautista missed his fourth straight game with back problems, and Lawrie has only played 3B since his return from the DL.  But you still get the idea, right?  Perhaps Bonifacio won’t see his playing time affected.

Conclusion

There is an advantage to be gained by keeping up to date with MLB news and then by thinking critically about that news.  Take your thinking to the next level.  Who else does this affect?  What are the intentions behind this move?  What related move could be coming next?

Consume a lot of Major League Baseball news.  This will allow you access to additional news items that those who only read fantasy advice might not get.

Baseball news is also available sooner than fantasy analysis.  It may take hours or days for fantasy analysts to identify, analyze, and write quality content about an event or news item.

Thanks For Reading.

Stay smart.


S.O.S. – A Simple Approach to Making Fantasy Baseball Decisions

After two weeks of the 2013 season, John Buck is the fifth best hitter according to ESPN and CBS.  The Tampa Bay Rays are off to a 4-9 start and are already in last place and five games back in the AL East.  There is news that Brett Lawrie was playing second base in his rehab stint.

What Does All This Mean?

That’s a great question.  And in a minute I’ll introduce a methodology to think through what these facts mean. A main tenet of Smart Fantasy Baseball is to teach or illustrate ways to become better at the game.  One area to target for improvement is the ability to think deeper and more critically about pieces of news or a players skills and make well informed strategic decisions. I think we can all get better at doing this.  We’ve gotten a bit lazy.

I love Mathew Berry.

I think he’s hilarious.  I think he generally gives good advice.  But as fantasy baseball and football have gained popularity, Berry has been pushed to the forefront as the fantasy industry’s star.  He writes witty articles, he co-stars on an entertaining podcast, and he appears on SportsCenter where he must attempt to give meaningful fantasy advice in 60 second segments.

And this is how a large percentage of us fantasy owners get our research.  On the ESPN Fantasy Focus podcast, you’ll often her Berry say, “I like player X more than player Y.”  In fact, a staple of the show is the “Name Game” where a series of similar players are rattled off and Berry states whom he prefers among the group.

The “I like player X more than player Y” fantasy advice is a huge pet peeve of mine*.  The reason being, there is often little or no “why” attached to that analysis. Because of this, I think there is a huge opportunity to separate yourself from an average fantasy baseball player.

Slow down and think critically about the decisions you are making.

Enter the “S.O.S.” framework to evaluating a player.

Skills, Opportunity, and Surroundings

I believe there are three significant components to a player’s fantasy value:

  1. Skills – A hitter’s ability to hit for power, hit for average, and steal bases. A pitcher’s ability to strike out batters, prevent runs from scoring, and keep batters of the base paths.  These skills can be evaluated by any number of statistical measures; HR/FB, xBABIP, FIP, K/9, etc.
  2. Opportunity – Skills don’t matter if a player doesn’t get opportunity to play.  A player can be trapped in the minors, blocked by an All-Star.  Or they might play for a bad team that aggressively promotes players.  They might be on the Major League roster but trapped on the weak side of a platoon or in a crowded outfield, battling for playing time.
  3. Surroundings – Players don’t operate in a vacuum.  They play in the AL or the NL.   They play in the AL East or they play in the NL West.  They play in Coors Field or they play in Petco Park.     They hit in a good offensive lineup or they play for the Marlins.  They hit third in the order or they hit ninth.  They might be the topic of trade rumors.  Or they’re injured.

Each of these factors should be considered in analyzing a player, interpreting a news story, or before making a move.  It is easy to rush into an ill-advised transaction if you haven’t considered all of these different facets. Putting this in a more visual mathematical equation, I come up with this:

OUTPUT = SURROUNDINGS * (SKILLS * OPPORTUNITY)

“Skills” is a raw and rough estimate of a player’s statistical output.  For the sake of this example, we can set this equal to what a player would be worth if they played 162 games or made 34 starts.

This “Skills” figure is then multiplied by the “Opportunity” factor.  “Opportunity” can range from 0 – 1.  Meaning a player can have all the skills in the world, but if you multiply “all the skills in the world” by zero… you get zero.

This result is then multiplied by an adjustment for “Surroundings”.  An average or neutral set of “Surroundings” would set this factor equal to 1.00.  If the surroundings are beneficial to a player’s output (they are a hitter in a hitter-friendly park on a strong offensive team batting in the heart of the order), the factor grows larger than 1.00.  Maybe to 1.25.  If the surroundings are poor and harmful to a player’s output (they are a hitter with home games in a very pitcher friendly stadium, part of a weak lineup, and bat 8th), the factor falls below 1.00, maybe to .75.

Go The Distance

If you build it, they will come.  Alright, enough Field of Dreams quotes.  But the point is to “go the distance” with your analysis.  We all fall victim to just considering a player’s skills in the equation above and don’t make the necessary adjustments for opportunity and surroundings.

More To Come

Stay tuned to Smart Fantasy Baseball for a more detailed discussion of how to apply S.O.S. and “case studies” using some real news items from the young 2013 baseball season. Please follow SmartFantasyBB on Twitter or subscribe to the blog using your e-mail address in the sign up box on the top right of any page.  Once you sign up, you’ll get any new post e-mailed directly to you.

Thanks for the follow

Be Smart.

*NOTE:  I repeat that I love Berry.  I “download and listen” to nearly every episode of the Fantasy Focus podcast.  I’m certain he understands advanced baseball metrics and applies them to his analysis.  Heck, he’s a member of the Fantasy Sports Writer Hall of Fame.  But he’s a celebrity.  His hands are tied because of the audience he serves (the masses) and the medium uses to relay his message (in working for ESPN he has to quickly get out his message).  He can’t delve into 15-minute long explanations about FIP and BABIP.

Pitchers Due for a Higher ERA in 2013

Pitchers who significantly outperform FIP are very likely to see a rise in their ERA the following year.  With this in mind, let’s take a look at the pitchers who significantly outperformed their FIP in 2012.

Outperformed FIP by Greater than 0.70

Based on recent history, nearly all of these guys (or 94%) should see an increase in ERA for 2013.  With that said, I could see Hellickson being an exception.  He has consistently outperformed FIP over his short career:

SEASON ERA FIP
2010 3.47 3.88
2011 2.95 4.44
2012 3.10 4.60
Career 3.06 4.46

A counter argument to Hellickson being an exception is that he currently has one of the largest career differentials between ERA and FIP for a starter in the history of major league baseball (although I don’t think FIP is available into the distant past).  So he either has a very rare skill not measured by FIP or really is due to see his ERA increase and approach his FIP calculations.  A quick internet search turns up the fact that this is a heated debate surrounding Hellickson (there’s are interesting discussions of this very topic here and here).

Hellickson aside, the others display career ERA similar to career FIP (although Weaver has displayed an ability to exceed FIP) and are my targets for a higher ERA in 2013.  As a Tigers fan, here’s my favorite Jered Weaver (and Carlos Guillen) moment.

PLAYER 2012 ERA CAREER ERA 2012 FIP CAREER FIP
Jered Weaver 2.81 3.24 3.75 3.65
Jason Vargas 3.85 4.35 4.69 4.48
Matt Harrison 3.29 4.08 4.03 4.27

I’d look to see Weaver’s ERA rise toward the 3.50 mark and Vargas’ up toward his career 4.35 mark.  Based on career ERA and FIP of 4.00+ and his 4.03 FIP from last year, Harrison’s 3.29 ERA from last year looks to see the biggest rise of the group.

Once below the 0.70 threshold, the likelihood of an ERA increase is smaller, but still 74%.  And the list of names is definitely “fantasy relevant”.

If I Had to Cherry Pick Some Names

Let’s look at some of these more “fantasy relevant” names and their career ERA and FIP:

PLAYER 2012 ERA CAREER ERA 2012 FIP CAREER FIP
Matt Cain 3.40 3.27 3.40 3.65
Jordan Zimmerman 2.94 3.47 3.51 3.56
R.A. Dickey 2.73 3.98 3.27 4.23
Hiroki Kuroda 3.32 3.42 3.86 3.62
Johnny Cueto 2.78 3.57 3.27 4.03
David Price 2.56 3.16 3.05 3.48
Mark Buehrle 3.74 3.82 4.18 4.14
Jon Niese 3.40 4.06 3.80 3.78

Adding moves from the NL to the AL into the equation, Dickey and Buehrle become obvious candidates.  Besides moving from an offensively challenged division to the AL East, Dickey also posted career highs in K/9 (EXTREME career high, from 5.78 in 2011 to 8.86 in 2012) and LOB%.

I’m looking to find more incriminating evidence against, Buerhle, but it’s not jumping out at me.  He’s only ever had an ERA over 4.00 in three of his 12 seasons.  Although he did have the second best BABIP of his career (.270 last year, career .289).  I’d look for a rise, but nothing to significant.

Cuteo may have just had a career year.  He was great in 2011 too, but he pitched 60+ more innings in 2012.  His control improved dramatically and is on a continued downward trend.  It’s difficult to expect another career year, but you can’t ignore the trends.  I do expect his ERA to rise, but not significantly (3.00-3.10 range).

Zimmermann’s control regressed some in 2012 and he gave up more HR/9 and HR/FB in 2012.  But nothing too extreme.  Look for his ERA to rise into the 3.40-3.50 range, just to fall in line with career averages.

I love Jon Niese.  From 2011 going into 2012 he played the reverse role, with a 4.40 ERA in 2011 and a 3.36 FIP.  That flipped in 2012 as he posted a FIP similar to his career average but managed a career best ERA.  Also suggesting an increase in ERA is a career low BABIP number of .272 compared to a career BABIP of .311.  Look for an ERA in the 3.60-3.80 range.

Reactions?

Which pitchers do you think are do for regression?  On this list or otherwise.

Resources

Statistics courtesy of Fangraphs.