Now That Football Is Officially Over…

WARNING:  This post was originally made prior to the 2014 MLB season.  The Projecting X Spreadsheet Template has since been improved!  For more information, please go to smartfantasybaseball.com/bundle.

If you’re looking for a project that will prepare you for the upcoming season and teach you how to create your own fantasy baseball projections, look no further.

I’ve created two videos that demonstrate Mike Podhorzer’s “Projecting X” and the additional materials I have created to go along with it.

First, some practical examples of how easy it is to update your own formula-driven Excel projections:

Second, a close up look of all that is included in “the bundle”:

Like what you see? Interested in supporting this site? Please click here.

Why Does Everyone Hate Alex Rios?

I don’t like Alex Rios.  I’m not sure if it’s because he used to go by the name Alexis.  Or maybe I owned him in 2009 when he hit .247.  Or maybe I bought into some hype telling me he would hit 30 HR in a given season and he stuck me with 17 instead.

Regardless.  I might be coming around on Mr. Rios.  Here’s why…

You’ve Got Mail

Remember when Meg Ryan was famous?  Anyways, I recently got an e-mail from a reader wondering if he should keep Jose Bautista, Justin Upton, or Alex Rios.

When I see a question like this, my first reaction is to eliminate the low hanging fruit.  So I wiped Rios out of the equation and started to think about Bautista and Upton.

Then I opened up my early 2014 projections:

Player H-RANK SGP AVG R HR RBI SB
Rios  11  5.03 .280 78 18 81 33
Upton  39  3.53 .269 97 26 73 12
Bautista  60  2.70 .264 82 28 78 7

 My Ranking Formulas Have To Be Wrong

My immediate reaction was that my ranking formulas had to be wrong.  Rios couldn’t be so significantly better than Upton and Bautista.  Or could he?

After all, Rios was the 9th ranked hitter on ESPN’s 2013 Player Rater (heck, he was 6th in 2012!).  Upton was 48th.  And Bautista was 59th.  All of those rankings look incredibly in line with my preseason rankings.  Maybe they are right.

If The Ranking Is Right, Then My Projections Have To Be Wrong

I’ve only done one pass through my projections as of the time of this post in early January 2014 (learn to make your own projections here).  Maybe I need to take a closer look at Rios and downgrade some of those stats.  Maybe I’m too favorable.  My projections are exclusively based on a player’s last three seasons.  So let’s take a look:

Year Age Tm G PA AB R HR RBI SB CS BA
2011 30 CHW 145 570 537 64 13 44 11 6 .227
2012 31 CHW 157 640 605 93 25 91 23 6 .304
2013 32 TOT 156 662 616 83 18 81 42 7 .278
Provided by Baseball-Reference.com: View Original Table
Generated 1/11/2014.

So my .280, 78R, 18 HR, 81 RBI doesn’t look unreasonable.  If anything, the counting numbers of R and RBI might be low when you consider he played most of his games last season for the AL’s worst team offense (CHW) to now having a full season in an above average offense from last year that is arguably even better (TEX).

Tm R/G ▾
TEX 4.48
LgAvg 4.33
CHW 3.69
4.33
Provided by Baseball-Reference.com: View Original Table
Generated 1/11/2014.

I started on this endeavor thinking I needed to bump down his projections (more on this later… this is a crappy way of thinking), and now I’m convinced he’ll probably score more R and have more RBI?  Heading in the wrong direction here.

It All Comes Down To Stolen Bases

Rios gets the bulk of his value from stolen bases.  So even if his R and RBI increase a touch, it’s not going to significantly affect things.

The key question to answer is can we really expect the 33 projected steals from a soon to be 33-year old aging outfielder?

I don’t want the point of this article to be exactly how I projected Rios’ SB totals, so I’m not going to go into great detail.  But when you consider the following facts, 33 is not unreasonable:

  • TEX led MLB in stolen base attempts (195 TEX, 147 CHW)
  • TEX was second in stolen bases (149 TEX, 105 CHW)
  • TEX was seventh in SB% (76% TEX, 71% CHW)
  • Rios had 17 SBA in 47 games for TEX last season (roughly on pace for 51 SBA for a full season)
  • Rios has a SB% of 80% the last three seasons, a rate which would give him about 40 SB in 51 SBA

So even if he slows his pace and begins to get caught more, there is cushion in that projection of 33.

For Argument’s Sake, What If We Project 20 SB

If the rest of his stat line remains the same and the projection of 33 SB falls to 20, his ranking adjusts from the 11th best hitter to 36!  He’s still ahead of Upton!

It’s Early, But Where Is Rios Being Drafted?

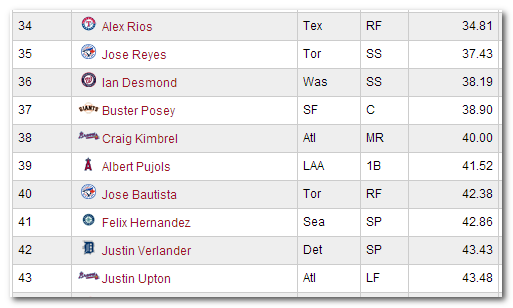
Rios is currently going 34th overall, with Bautista going 40th, and Upton going 43rd.  I obviously have to familiarize myself more with this ADP information.  I should not have dismissed Rios out of hand the way I did.

Alex Rios, Jose Bautista, and Justin Upton NFBC ADP as of January 11, 2014 courtesy of Stats.com

Let’s Learn From This

This whole exercise demonstrates two important lessons.

First, this is a perfect demonstration on how to find value by making your own rankings and projections.  Remember, Rios came out as the 11th best hitter in my projections!  He’s being drafted 34th overall!

This is not to say that you have to agree with my assessments of Rios.  But if you go to a top 200 list at popular fantasy websites, you will probably see Rios ranked in the 30s or 40s.  If you run your own projections and realize he comes out at 11, you have FANTASY GOLD on your hands.  You can take a player in the 3rd or 4th round that you think will return 1st round value!  I hate to repeat myself, but this is exactly why you need to be get your hands dirty and make your own rankings and projections.

Second, it was an awful mistake for me to look at my ranking and want to search for ways to downgrade Rios.  I spent hours of time developing my own projections using proven methods and then running objective mathematical formulas to calculate each player’s value from those projections.  The ranking is what it is.  The projected stats are what they are.  And they are calculating a very strong ranking.

It’s not wrong to double-check and possibly adjust your projections.  But that’s not really what I tried to do.  I don’t like Rios.  I know this.  I was purposefully considering a decrease in his projected stats just so he would fall in the rankings to where I thought he “should be”.  That’s a mistake.

Just because he comes out ranked 11th doesn’t mean I need to draft him 11th.  That’s the value of good ADP information and planning your draft out ahead of time (knowing you might be able to wait until the 3rd round).

Now That I’ve Completely Jinxed Rios’ Season…

Thanks for reading.  Be smart.


An Important Concept Behind Making Projections

Envision a Major League Baseball player’s stat line.  If you’re having trouble doing that, here’s one:

Paul_Goldschmidt_2014_Projection
Paul Goldschmidt’s recent MLB stat lines, courtesy of Fangraphs.com.

Those are Paul Goldschmidt’s Major League statistics for the last three seasons.

How Do We Take That Information And Create 2014 Projections?

Do we just eyeball it and say, “He hit 20 HR in 2012 and 36 in 2013, so I’ll project 28.”?   Do we give more weight to 2013, because it’s the most recent season?  Is Goldschmidt still improving?  Could he hit more than 36?

What about stolen bases?  Or batting average?  Runs?  RBI?

There are a lot of moving parts here.  And they’re all somewhat related to each other. How do you make sense of all this information and develop a sound, reliable, and accurate projection for what will happen in 2014?

We Have To Disaggregate the Data

“There you go again, Tanner.  Using words like ‘disaggregate’.  What does that even mean?”

An Example

Assume you own an ice cream cone stand and you’re trying to project what sales of ice cream will be this month.  What factors would go into that calculation?

You could just project it at a very high level and say, “Sales were $10,000 last month and $9,000 the month before.  So I will estimate $9,500 for the current month”.  And that might give you a reasonably close estimate.

But the key to accurate projections is to look at underlying data or events that make up that end result.  You want to break apart the big event, or disaggregate it into smaller events you can study and measure.  Instead of trying to guess the ending sales result, you’re better off trying to project the smaller things that make up that monthly total:

  • The average selling price per ice cream cone
  • The number of ice cream cones sold
  • How many hours is the stand open each day?
  • How many people will walk by the ice cream stand in a day?  In an hour?
  • Out of every 100 people that walk by the stand, how many buy a cone?

After you have estimated this information, you run the math and calculate the total sales for the month.

Why This Works

It’s hard to just look at $9,000 and $10,000 of monthly ice cream sales and make sense of those numbers.  But if you know that you raised the price of each cone 25 cents, that you just hired an employee that will allow you to keep the stand open longer each day, that the employee has a striking resemblance to Jennifer Lawrence (with long hair, please) and has an uncanny ability to sell ice cream, and that there is a large festival taking place this month that will bring an extra 5,000 people by the stand, then you’ll be able to make a much more accurate projection than you would by simply looking at past monthly sales figures.

Applying This To Baseball

You can think of our typical rotisserie baseball categories as aggregated data, like the monthly ice cream sales.   When you break it down a home run is actually the end result of many smaller outcomes that added up to the end result of a baseball being hit over the fence.

All of these events have to happen for a home run to occur:

  • The ball has to clear the fence, which means:
    • The ball has to travel X number of feet
    • The fence is < X from home plate
  • The ball has to be hit in the air (a fly ball)
  • The hitter has to have an at bat, which means:
    • The hitter has to have a plate appearance
    • The hitter has to make contact (no swing and miss)
    • The hitter has to swing

We could take this further, but you get the idea.

We Live In An Amazing Time

Fortunately, we have data available (for free!) to measure every bullet point above.  Sticking with our original Goldschmidt example:

Continue reading “An Important Concept Behind Making Projections”

A Warning About Calculating Replacement Level

Wow, I screwed up.

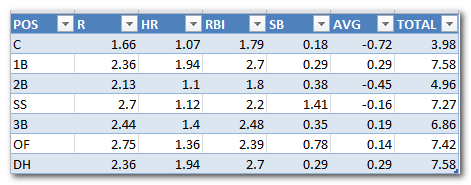
2014 Position ScarcityI recently finished my first rankings and projections for the 2014 season.  And after I sent all the projection information into the little black box, it kicked out some really crazy looking results.

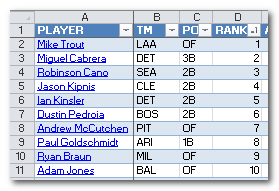
Cano, Kipnis, Kinsler, Pedroia right in the heart of the first round?  Nice rankings, bonehead.

Here’s What I Did Wrong

Let me share my failure so you can avoid making the same mistake I did.  You might recall that the rankings approach I use includes an adjustment for “replacement level”. It’s essentially a way to capture positional scarcity.

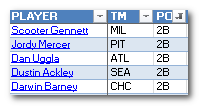
2014 ErrorI usually assume a standard rotisserie format when creating rankings, so for a 12-team league starting 2B, SS, and MI, I assume “replacement level” is right around the 17 – 21st ranked players at each position (12 2B starters plus about 6 more drafted to play MI).  When I looked at this neighborhood of players, I came up with Scooter Gennett, Jordy Mercer, Dan Uggla, Dustin Ackley, and Darwin Barney as “Replacement Level”.  A sad cast of characters.  Darwin Barney?  How did I not catch that?!?!

2014 Position AdjustmentsI then went the next step and included this 2B replacement level measurement in the replacement level table for all positions (see the table image above).  It’s very clear that something is out of whack with 2B.  With the exception of catcher, which we know lacks in offensive production (and the effect is worsened for two catcher leagues), all the other positions are within 0.7 standings gain points of each other.

How I Assign Players’ Positions

It becomes very difficult to rank players that qualify at multiple positions.  I haven’t found an effective way to calculate it yet.  So I assign players to only one position, and I choose the position that is “weakest”.  Assigning a player to the weakest position gives them the most value, so I think it’s a reasonable shortcut to deal with players like this.

What I Screwed Up

I failed to account for position changes for several very solid second base options.  Specifically I still had Matt Carpenter (1B), Jedd Gyorko (3B), Martin Prado (OF), Jurickson Profar (SS), and Anthony Rendon (3B) listed at other positions.  But clearly all should qualify for 2B eligibility in 2014.

And I essentially failed twice, because there are at least two other solid fantasy contributors that I still had listed as SS, but would conceivably qualify at 2B.  Both Ben Zobrist and Jed Lowrie fit that bill.  If 2B has such a low replacement level, players that qualify at 2B and SS to be moved to the 2B listing.  Any good fantasy player would realize the weak 2B market and draft these multi-positional players to fill the void.

Replacement Level Needed To Move

So when I calculated replacement level and looked at those players ranked around the 17-21 spot for 2B, I was really looking at players 22-26.

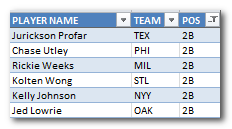
2014 2B Scarcity2After adding the missing second basemen, spots 17-21 shift to become Jurickson Profar, Chase Utley, Rickie Weeks, Kolten Wong, and Kelly Johnson.  Then below Jed Lowrie and Marco Scutaro come in at 22 and 23.  That’s more like it!

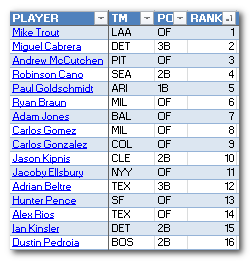
Calculating replacement level off of these players shifts the ranking calculations of every 2B, and here are the updated top 16 rankings:

2014 Preseason Rankings

Wow, what a HUGE difference.  The puts the 2B more in line with what you would expect and it also has a rippling effect on other players too.  Goldschmidt moves from eighth to a much more reasonable fifth.

Lessons Learned

I need to incorporate a much stronger “reasonableness check” into my rankings and not blindly trust that I entered every formula, every Excel sort, every player position, and every player ID correctly.

Don’t make the same mistake as me!

But in the end, this was a very interesting exercise that showed me just how dramatic of an effect position scarcity can play in rankings (especially if it’s done incorrectly).  You always know it’s there, but it’s difficult to quantify if you don’t go searching for it.

I was just off by five or six players in determining replacement level.  If it only takes a handful of players to have this big of an effect on player valuation, think about what position changes and injuries during the season can theoretically mean.  Something to keep in mind for in season trading…

Thanks for reading.  Don’t make unsmart mistakes like me.

Case Study – Weighted Average Probabilities and Ryan Braun

Hindsight is 20-20.  We all know this.  And now that Ryan Braun has been suspended for his association in the Biogenesis scandal, it’s easy to to say that we overvalued Braun in our draft preparation.  But let’s look back to what we knew in the preseason and use this as a learning opportunity to apply a lesson in weighted average probability and expected results.

What Did We Know?

News surfaced in early 2013 that Ryan Braun and numerous other players were associated with Biogenesis.  Documents were obtained that showed an official link between the players and the clinic.   There was speculation that the players involved could face suspensions during the season.

We didn’t know much more than this.  Would players miss 50 games?  100 games? Would the suspensions come down during the 2013 season?  Or after?  Could MLB even uncover enough evidence to support suspensions?

What Could Happen?

For Braun, we could reasonably assume he’d be the target of a 100-game suspension. He was nearly the recipient of a 50-game suspension in the fall of 2012, but managed to avoid it on a technicality.  So new evidence could push him from a first-time offender to a second-time offender (and a 100-game penalty).

Let’s Start A Basic Projection For Braun’s 2013 Season

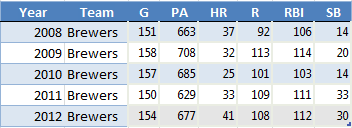
If we are to build a projection for Braun’s 2013 season, a reasonable place to start would be to look at career averages.  Braun played a partial season in 2007 and played at least 150 games in 2008-2012.  So let’s use these last five years of “full seasons” and figure out the average production as our baseline estimate:
WAP1

These average to 154 games, 672 plate appearances, 34 home runs, 105 runs, 109 RBI, and 22 SB.

But What If This Isn’t An Average Season?

We know Braun was nearly caught as a PED user in 2012. So what if he was scared into stopping his use of PEDs?  Can we build this into our estimate?

We don’t have any scientific data to understand the exact effect of PEDs.  So let’s throw out a rough guess and say we think the effect of stopping the use of PEDs would slightly decrease his production.  We’ll say his numbers would remain at 154 games and 672 plate appearances, but he drops to 25 HR, 90 R, 90 RBI, and 20 SB.

To summarize our two scenarios:

WAP2

How Likely Are These Scenarios To Occur?

You might have your own beliefs about the likelihood of each, but for the sake of example let’s say we think Braun is 90% likely to have another year in line with his past five seasons and 10% likely to experience a year where the effect of no PEDs drags his performance down some.

WAP3

And What If He Gets Suspended?

Again, for the sake of illustrating a simple example, assume a 50% chance Braun does not get suspended during the year and a 50% chance Braun misses half the season.

These 50-50 alternatives are subsets of our previous two scenarios.  So the 90% chance Braun has another average year now becomes a 45% chance (90% * 50%) he has a career average year and does not get suspended and a 45% chance he has a career average year and does get suspended.

Likewise, the 10% chance he sees a drop in productivity due to coming off PEDs is split into a 5% bucket of not being suspended and a 5% bucket of being suspended.

Regardless of the scenarios we lay out, we must remain at 100% total probability for all the possible outcomes.  Something has to happen.  And with 45, 45, 5, and 5, we’re still at 100%.

WAP4

Weighted Average Probability, Expected Results

Once you have probabilities for each possible outcome, it’s easy to calculate the total expected result.  We simply multiply the expected statistics for each scenario by the likelihood of that scenario.  This is the “weighting”.

Look at the 5 Year Avg – No Suspension example.  We have determined this scenario has a 45% chance of occurring.  45% multiplied by 672 plate appearances is 302.40.  45% multiplied by 34 home runs is 15.3.  And so on.

Here are the weighted averages of all scenarios:

WAP5

Our overall or actual expectation is the sum of each different weighted scenario.  You can see this total at the bottom of the table above.  After taking all possible scenarios and their probabilities into account, we estimated Braun for 25 HR, 78 R, 80 RBI, and 16 SB.

The Bigger Point

This approach of calculating weighted average probabilities can be used in many different scenarios.  Do you think there’s a 25% chance Troy Tulowitzki plays a full season, a 50% chance he plays 120 games, and a 25% chance he plays 80 games?  Do you think a rookie has a 25% chance of being called up in May, 25% in June, and 50% in July?  Do you think there’s a 50% chance a player will bat leadoff during the year and a 50% chance he’ll bat 9th?  Is there a 25% chance a rookie call-up will break onto the scene and be very productive, a 50% chance he’ll be an average player, and a 25% chance he’ll be sent back to the minors?

In any of these situations, calculate an estimated outcome and weight it using the probability of that outcome occurring.

Be Smart

Thanks for reading and continue to make smart choices.