Use PITCH f/x Data To Identify Potential Breakout Pitchers (Part III)

If you’ve made it to Part III in the search to identify potential breakout pitchers, congratulations.  If you missed them, you can find Part I here and Part II here.

Enough Talk, Where Is This List Of Potential Breakout Pitchers?

I’ve uploaded an Excel file to Microsoft Sky Drive.  You can edit, view, or download the file for your own uses.  It’s mostly the same data from the YouTube video, but I added a lot of bells and whistles.  A red cell indicates a pitch that has declined in use from 2012 to 2013.  A green cell indicates a pitch with more usage.  The color intensity indicates the magnitude of the change.  The links to the right take you directly to that specific player’s page on BrooksBaseball.net.

PitchClass14
Click on the image to be taken to the editable file (you can edit or download for your own use).

Disclaimer #1

Keep in mind, I started this analysis on June 24th, 2013.  So if you’re finding this information after that time, you may want to double-check the usage graphs for any pitcher you’re researching.  But I’ve tried to document the approach to doing this research in the video and other parts of this series.  You can perform this research at any time (it would be great if we could get monthly usage reports from Fangraphs, then we could do this in the offseason to identify pitchers who started to change their mix late in the season).

Disclaimer #2

You saw from Part II of this series that these changes in mix have to be taken with a grain of salt.  And even after you’ve verified that there is indeed a change in pitch mix, you still need to go review the effectiveness of the pitches being used more frequently.  I wish I could go through each of these pitchers and break them down for you.  But it’s just not practical (my two-year old and four-year old don’t find PITCH f/x research very entertaining).  Hopefully I’ve equipped you with the tools you need to go analyze these pitchers more closely.

For pitchers on your team, check them out.  If you’re thinking of picking up a free agent, check him out.  If your pitching staff is terrible and you need to find the next big ace, check them all out.

Conclusion

Granted, it’s a small sample size.  But I’ve done a deep look in this fashion for Edward Mujica, Max Scherzer, and Alexi Ogando.  And all show promising results.  There will certainly be pitchers that change their mix and it has little effect on their end results.  But this seems like a promising exercise.

PLEASE LET ME KNOW WHAT YOU THINK Or If You Have Questions

I realize this is quite involved.  It’s certainly more difficult than reading the weekly pickups columns that are out there.  But anyone can read those and snag players just as easily as you can.  This process will put you ahead of the curve, give you players to monitor, and give you first crack at picking them up.

Thanks and be smart.
 

Use PITCH f/x Data To Identify Potential Breakout Pitchers (Part II)

Picking up where we left off in the post “Use PITCH f/x Data to Identify Potential Breakout Pitchers“, now that we’ve identified the potential pitchers (link to pitchers with differences) who have added a new pitch or that have significantly adjusted their pitch usage mix in 2013, we need to determine if the new or more heavily used pitch is successful.

Before We Go Any Further

I think it’s important you read the article The Internet Cried A Little When You Wrote That On It, by Mike Fast (follow Mike on Twitter).  The whole article will be helpful if you’re trying to improve you understanding of PITCH f/x, but at least read bullet #1.

My takeaway from that piece is that significant changes in pitch mix, especially within the fastball classifications (FA, FT, FC, FS, SI), are most likely to be changes in the algorithm used to classify the pitch.

Take for instance, Jake Peavy.  The PITCH f/x data I downloaded from Fangraphs and manipulated to identify “potentially” new pitches, shows the following for Peavy:

PitchClass2

Interpreting that chart, from 2012 to 2013, the Fangraphs data shows a decrease in the fastball (FA) of 19.9% and increase in the two-seam fastball (FT) of 26.7%.  That sounds interesting on the surface, no?  Decrease one pitch 20% and increase another?

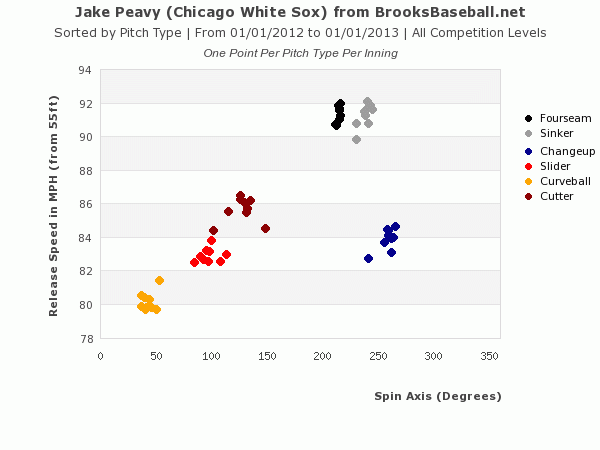
From Mike Fast’s article we know that we can’t necessarily trust the pitch classifications.  So let’s look at the 2012 velocity and spin on Peavy’s pitches:

PitchClass4
Click image to be taken to this page at BrooksBaseball.net

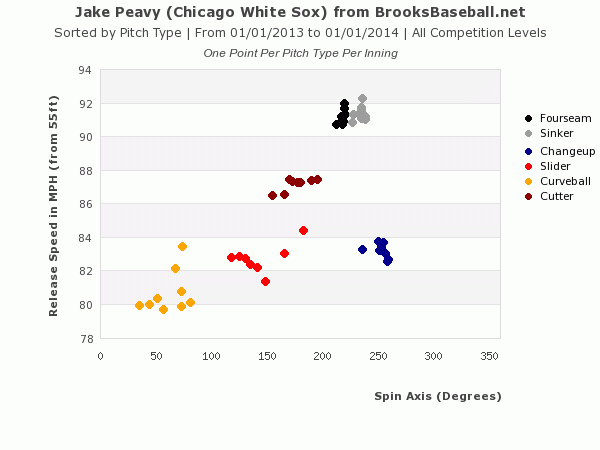
And the same for 2013:

PitchClass3
Click image to be taken to this page at BrooksBaseball.net

From these two charts you can see Peavy’s throwing the same pitches in 2013 that he was throwing in 2012.  The clusters are in the same general vicinity on the chart.  But more importantly, you can see there is very little difference between the fourseam (FA) and the sinker (BrooksBaseball calls the two-seam fastball a sinker (FT)).     So a 20% transfer from one classification to another is likely a change in the algorithm, as we were warned.

Give Me Someone Else to Look At

Alright, Alexi Ogando, although injured recently, has been intriguing.  The raw data shows a sharp decline in fastball usage and an increase in the changeup.  This probably isn’t just a case of an algorithm change (fastballs wouldn’t likely be misclassified as changeups).

PitchClass10

Let’s look at his 2012: Continue reading “Use PITCH f/x Data To Identify Potential Breakout Pitchers (Part II)”

Video: Use PITCH f/x Data To Identify Potential Breakout Pitchers (Part I)

I’ve talked before about the amazing tool we have at our fingertips in PITCH f/x.  I’ve also had two (Scherzer and Mujica) instances this season where I came across seemingly small anecdotes about a specific pitcher adding a new pitch, and the pitcher in question has gone on to have a “breakout” season thus far.  So I thought to myself…

Why Not Look For More Pitchers Who’ve Added A New Pitch

And rather than just share the results with you, I thought it might be more beneficial to share the method I used to do my search.  You know, the whole “teach a man to fish” proverb.

While there is a lot of great PITCH f/x data available at sites like Fangraphs and BrooksBaseball.net, I have not been able to locate a resource that allows me to do a year-to-year comparison of the data across a large pool of players (BrooksBaseball can show you great comparisons for a specific player).  So to identify these pitchers who have developed a new pitch, I had to download sets of data for 2012 and 2013 and apply some functions in Microsoft Excel.

I recognize that some of my posts get a bit lengthy and this process may have pushed the limits, so I’m trying something new and have put together my first YouTube video (if you’re interested in being notified of future videos, click here to subscribe to the SFBB YouTube channel).

About The Video

The video is approximately 15 minutes long, and takes you through a step-by-step process to download PITCH f/x pitch usage data from Fangraphs.com, pull the data into Excel, match up 2012 and 2013 pitch usages, calculate a difference in pitch usage, use the calculated difference to target players that are most likely throwing a new pitch in 2013, and how to use BrooksBaseball.net to conduct further research on individual pitchers.

Coming Soon

I’ll polish up the results and post an Excel file, containing pitchers to keep an eye on, for you to analyze.

Thanks for reading… and watching.  Stay smart.