I recently participated in my The Great Fantasy Baseball Invitational (TGFBI) draft, which, if you’re a Twitter user and follow anyone in the fantasy baseball landscape, you could not have avoided. I do want to share with you some observations I had during the draft, but similar to my other writings, the goal here is to give some actionable advice (even if you’re reading this in the future) and not get too hung up on my team and specific players.
The Context
The invitational is made of 13 separate 15-team leagues. Each of these leagues will compete like any traditional rotisserie league and crown a champion within that league. The twist is that there is also an overall competition across the 13 leagues, whereby all 195 teams are competing in one massive rotisserie competition to crown an overall champion (similar to how the NFBC works). The one person that emerges atop 194 other experts can surely claim to be one of the best fantasy baseball players around.
This is the inaugural year of the competition, but it’s such an innovative idea that there’s no shortage of well-known folks competing. You can see the full list of participants here.
I’m participating in League #13. I happen to be the last name on the roster of the last league! What does that tell you, ha! You can see the draft results here. I was picking from the fifth spot.
My Feelings Going Into the Draft
While I’m obsessed with fantasy baseball, I really don’t view myself as anything special in this arena. Sure, I’ve MacGyver’ed up some neat spreadsheet tools over the years. But I don’t view my preparation process as anything special. I DON’T DO ANYTHING YOU’VE NEVER HEARD OF BEFORE. I’m not holding back any secret tricks of the trade.
And because I don’t do anything special, I was nervous as hell heading into this draft. I joked a few paragraphs back about being the last name on the last league. I don’t really know if that’s indicative of anything, but even if it is, I get it! I don’t even think I’ve written five legitimate articles in the past two years. It wouldn’t surprise me if that’s the lowest output of any participant involved. Meanwhile, many of the others are busting their backs to write articles and create podcasts on an aggressive and regular schedule.
These guys and gals are painstakingly combing over StatCast data, spin rates, hard hit rates, launch angles, swinging strike rates, and more… Meanwhile, I pretty much just let them do the work, read their articles, listen to their podcasts, plop some projections into a spreadsheet, make some manual adjustments, and I’m ready to rock with a comprehensive list of players and expected earnings dollar values.
Imagine my feelings when I’m now competing against some of the folks I admire the most in this business… Mike Gianella, Mike Podhorzer, Jeff Zimmerman, Rudy Gamble, and Rob Silver, to name a few.
Alright. Enough about me. Let’s try to make this useful. I apologize if some of what follows comes across as inflammatory or soap-boxy. Not everything can be sugar-coated. Here are my top lessons learned and observations after participating in this draft.
#1 – Exploit the League Rules
I really, really, really didn’t want to start with this one. It’s what EVERY SINGLE introduction to fantasy sports article ever written in the history of the world has started with.
So you would have expected that every one of the 195 participants would have done this, right?
But guess what??? I’m speculating, but I’d bet less than half of the TGFBI participants gave the rules a worthwhile look (I do realize saying “the TGFBI” is probably redundant, but it looks too weird not to do it). They probably assumed we were playing by prototypical standard rules and just checked to determine if we were using batting average or on-base percentage. But there are two rules we are playing by that are not exactly “standard” and each was something that I think needed to be known going into the draft. These two rules should have affected your behavior in the draft, and possibly in a significant way. Those two rules are:
- Starting rosters include only one catcher but two utility spots
- Rosters allow for five reserves and up to five DL spots for injured players
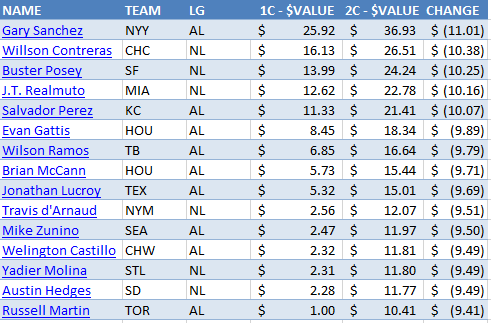
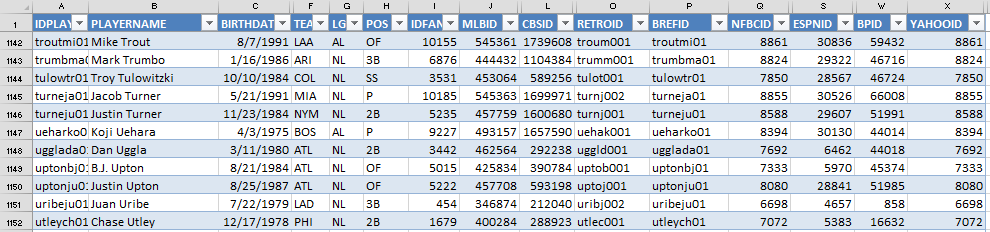
Why does this matter? In a 15-team league, I show the effect of going from two starting catchers to one as having around a $10 swing in value! That is an ENORMOUS detail (Note: the values in the image reflect the change from 2 C & 1 UTIL to 1 C & 2 UTIL, not just the move to 1 C).
The fact that this change is so significant surprises some people. But these are the same objective calculations that tell me Mike Trout, Trea Turner, Jose Altuve, Chris Sale, Clayton Kershaw, and Max Scherzer should be the highest valued players for the 2018 season. This isn’t speculation or “feel” about how to adjust for position scarcity. If you want to read more about the reason for this, here’s an illustrated example I put together from a few years ago.
As some of the faster drafting leagues started to get into the second and third rounds, we saw the big name catchers start to go. Then word quickly spread over Twitter, “This is a one-catcher league.” The effect quickly kicked in and the catchers starting plummeting. I’m a little disappointed this had to spread like a juicy rumor. I’d have expected everyone to know this going in.
I also suspect that many folks were worried the rules allowed for five reserve spots and no recourse for injured players. I believe this is how NFBC leagues and Fantrax leagues that allow for transactions operate (e.g. NFBC Main Event). I don’t have hard evidence to support this claim, but it just seemed like injured players like Michael Brantley, Michael Conforto, Jimmy Nelson, and Alex Reyes were going later than they should have been. My guess is they’d have been pushed up draft boards aggressively had everyone known this.
Small tip here. I don’t mind pushing up these injured players when you have a realistic way of replacing them that won’t burden you (force you to keep dead weight on your roster). Not only do you secure a talented player at a discount, you get the added benefit of being able to take chances on the waiver wire early in the season, when the odds are higher that you’ll be able to find a hidden gem.
My takeaway here is to not take anything in the rules for granted. Comb over them. Think about what the wrinkles in the rules might allow or incentivize you to do. Tailor your rankings and calculate your dollar values with these rules in mind. And don’t assume your enemies are doing the same. This can be an edge.
#2 – Use Dollar Values Tailored to Those League Rules to Make Decisions
My stance on this is simple and straightforward. If you’re not drafting with a set of projection-based dollar values in mind, you can do better.
I don’t care if you calculate them yourself, if you use the Fangraphs auction value calculator or the Rotowire custom dollar values, or if you buy a piece of software that does it for you… You’re not optimizing your chances of winning if you’re not drafting from values. You need a framework for comparing two hitters to each other, for comparing a hitter to a pitcher, and for making educated decisions. This is what dollar values do! Without dollar values, you’re being subjective. You’re letting biases creep into your decision making.
Do I have evidence that this approach works? The folks at Friends With Fantasy Benefits (specifically @smada_bb) undertook the incredible task of tracking and logging all 13 drafts into a Google Sheet with projected standings and it seems to support what I’m saying.
Overall Projected Top 10 pic.twitter.com/UYz1dMszEH
— smada plays fantasy (@smada_bb) March 16, 2018
I don’t know exactly how every analyst drafts, but based on following folks on Twitter, reading certain sites, and discussions I’ve had with people, I’m pretty certain these folks all do value-based drafting:
Continue reading “Hopefully More Than Just Another Draft Recap”