I’m a firm believer that using customized projections and running those through a valuation system, like standings gain points, is the single biggest leap a fantasy owner can take in improving at fantasy baseball. The problem with taking that step is it’s a significant hurdle to get over.
It’s complicated. It takes learning advanced Excel skills. It’s time consuming. It’s not for everyone.
I’ve been hard at work to help solve these problems. It’s taken several years, but I’m finally able to announce the new Automated SGP Rankings Excel Tool. With this Excel tool, you’ll be able to calculate rankings and dollar values from your favorite projection set within minutes. You can use Steamer, any other Fangraphs projection set, Rotowire, Mastersball, and even PECOTA. Whatever projection set you have access to should work.
Interested in learning more about this tool? Watch the following video or click here to read all about its features.
The Automated SGP Rankings Excel Tool is now available for the 2019 season! This tool will save you huge amounts of time. You won’t be stuck troubleshooting Excel formulas. You can focus on player research and forming your own opinions about players. You’ll have custom dollar values to make decisions from. Those values will be tailored to your league’s specific settings. It’s a great step toward winning your league this upcoming season.
The Excel tool currently works with the following rotisserie categories:
| Hitting Categories | Pitching Categories |
|---|---|
| Runs (R) | Wins (W) |
| Home Runs (HR) | Saves (SV) |
| Runs Batted In (RBI) | Strikeouts (K) |
| Stolen Bases (SB) | Earned Run Average (ERA) |
| Batting Average (BA) | Walks + Hits per Inning Pitched (WHIP) |
| On Base Percentage (OBP) | Quality Starts (QS) |
| Slugging Percentage (SLG) | Holds (HD) |
| On Base Plus Slugging (OPS) | Saves + Holds (SV+HD) |
Click here to read more about its features and to purchase the tool.
This looks awesome Tanner! As long as you’re crafting an OBP version, can you throw in QS too?
Hi, Rocky. Noted. I think OBP will be the first hitter category I go after and QS the first pitching.
Hey Tanner,
So I’m in a 12 team 5×5 roto league that uses HR, RBI, SB, OBP, SLG for hitters and QS, SV+HD, ERA, WHIP, K/9 for pitchers. I’ve noticed that most of the SGP factors posted for these stats use league formats that do not quite match mine. For example, one league format might suggest that it takes 0.0022 OBP points to move one spot in the rankings. But the rest of the hitting cats include R, RBI, SB, K. Even though some of the cats are different, would it be reliable to pull RBI, SB, and OBP data from this sample for my league?
Hi Matt, I have not officially studied this, but I would venture a guess that the change in categories doesn’t affect the SGP factors too significantly in the other categories, but probably does have some slight effects. You might try doing your own basic calculations on your league’s history for HR, RBI, SB, etc. There’s a free Excel file you can use here to calculate on your league standings: https://www.smartfantasybaseball.com/2015/02/excel-tool-sgp-slope-calculator/
Not to give you too much homework, but even after doing those calculations, you might also try converting them to a “relative” factor using the instructions here: https://www.smartfantasybaseball.com/2017/01/standings-gain-points-for-nfbc-leagues/
The relative factors will be more comparable and should help you see how similar they are.
Unfortunately, I only have one year of data with this league format. We changed a few cats and went from 14 teams to 12 teams.
I went ahead and calculated the SGP factors with this 1 year sample anyway, but some of them seem pretty far off from the SGP factors available to the public. Most formats seem to suggest that around 18-22 RBIs are required to move up, while my league last year required 26.8. Similarly, the OBP from my league last year had a distribution of 0.0017, which grossly overweights this category compared to the 0.00223 posted in this article https://www.smartfantasybaseball.com/2014/02/calculating-standings-gain-points-for-obp/
Even when I try to filter out the outliers and use the SLOPE formula, my values don’t compare quite like I’d expect. Is this more because of the competitive balance in my league or just the product of a 1 year sample?
If you haven’t read the relative vs. raw article I linked to, I’d highly recommend it. That may solve your problem. If it does not, perhaps there are differences due to the competitive balance in your league or it could be that adding those extra categories does have a big effect on the player pool. Maybe those additional categories affects who is owned and in what combinations players are owned, that you don’t see in standard leagues.
Wow, really good stuff there. The theory behind relative SGP was something I was beginning to pick up on myself, but never knew how to apply it. After comparing my league’s Relative SGP against others, the individual categories remain fairly consistent even when comparing formats with slightly different cat combinations. I filtered out the top and bottom values for the stats that didn’t match up as much as I’d like. These slight adjustments gave me the confirmation that my SGP factors were reliable enough to continue. I used Fangraphs Depth Charts as my projection system to assign player values, and… holy smokes… my model suggests that Mike Trout is worth $84.61. The next closest is Mookie Betts at $57.92. I know Mike Trout is great and all, but this seems way too high. When I look at player rankings alone, it passes the eye test. But there’s no way Trout is worth that much more than the next best guy. Any thoughts?
Depth Charts projects Trout to hit 43 HR, 109 RBI, 20 SB, .440 OBP and .630 SLG over 656 PA. Right off the bat I’m skeptical of this stat line, even for someone as good as Trout. But, I assume it’s not too far off from what other projections are saying, but haven’t gotten that far yet. You think the $84 value is because there’s an error in my model, or is it because the projection I’m using is rather bullish towards Trout?
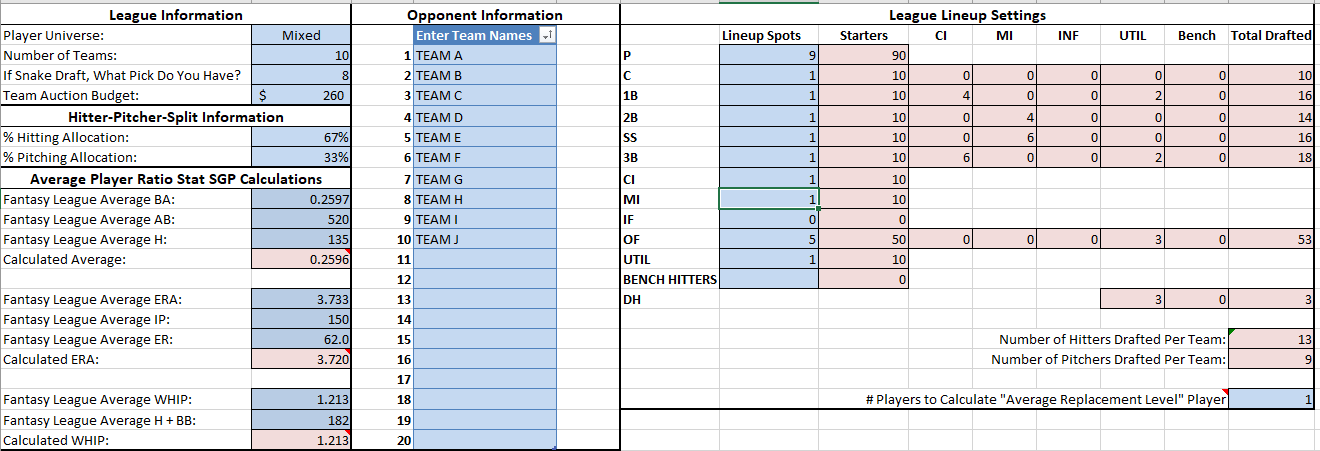
If I see unusual values, I check a few things. Do all hitter values for those above replacement level total up to the proper amount? For example, if you are in a 12-team, $260 budget, with a 67-33 split, hitters should total $2,090.40. Do your replacement level players have a value of $1? If you see higher or lower values than that right at the replacement level players, you have a problem. You may need to adjust what replacement level is.
It’s also difficult to conceive what a value for Trout would be in a league like that. He’s got to be close to top-5 in each of those categories and may have enormous edges in OBP and SLG. Not to mention the PA.
This looks like the problem. If all replacement level players are assigned $1, how does that affect all players above replacement? Why changes are necessary to my formula to ensure the sum of all values equal $2090.40?
My value formula is something like ([TOTAL SGP] – [REPLACEMENT LEVEL SGP]) * $ PER USERFUL SGP + $1. This makes the replacement level player have 0 SGP over replacement level. And his value will push to $1.
For those that may be following this string of comments or awaiting news on an updated version of the Automated Ranking Tool, I just released a new version tonight that includes OBP, SLG, OPS, Quality Starts, Holds, and Saves + Holds.