Just How Much Does Playing Time Matter?

If you’re a dedicated Smart Fantasy Baseball reader, you know I like to harp on playing time as an often overlooked and under-weighted component of player value.  Well I now have some proof to back it up!

Check out this guest post I wrote at baseballprof.com.

Baseball Professor

I took the results of a real rotisserie league of mine and analyzed the standings to find out just how important the effect of playing time was on the final standings.  Pretty tables, Excel conditional formatting, and more.

While you’re over there, please take a look around.  The guys from Baseball Professor crank out a lot of high quality content.  I can only post one or two articles a week.  So if you’re looking for more smart fantasy information to consume, check out baseballprof.com.  These guys work their tails off and it’s sabermetric-oriented, interesting, and diverse.

The group was also kind enough to invite me to participate in an early 2014 mock draft. It feels great to already get some of those draft anticipation juices flowing.  In fact, I’ve already received a few e-mails from SFBB readers about how they can start preparing rankings and projections for the 2014 season.  It’ll be March before we know it!

How To Gain Rotisserie Points On The Last Day Of The Season

A common piece of preseason draft preparation advice is to know your league’s rules, to make sure you’re properly valuing players.  There are also some very important rules to keep in mind for the end of the season.  Rules a lot of fantasy managers aren’t aware of. Rules that will allow you a competitive advantage if you know them and how to apply them to your benefit.  

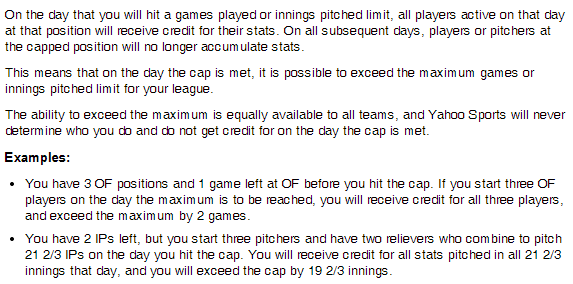
If you play in a rotisserie league on any of the major fantasy baseball providers (Yahoo!, ESPN, CBS), your league likely has some form of an innings pitched limit. Understanding how this limit is applied can allow you to gain an edge in the starting pitcher counting categories of wins and strikeouts.

The Rule

For each of these major websites, the innings pitched limit is applied at the end of the day on which you surpass the limit.  This means that you can actually surpass the limit established in your league rules by loading up on starting pitchers the day you expect to reach the threshold.

An Example

Assume your league has a 1,500 innings pitched limit.  During the final week of the season you sit at 1,490 innings pitched.  You then drop any pitcher not starting the next day and pick up a streaming option that does pitch.  You do this with all seven pitching spots in your line up.  The next day your seven starters pitch a combined 45 innings, strike out 38 batters, and earn four wins.

In this example, this strategy allows you to exceed the innings pitched limit by 35 innings, accumulating 25+ extra strikeouts and a few extra wins.  Depending on the standings in your league, this can most certainly allow you to gain a few additional points in the standings…  And maybe even win your league.

Applying This In Practice

This will be much easier to implement in daily transaction leagues where you can drop all your players on a given day and pick up tomorrow’s scheduled starters.  But you could conceivably do this in weekly lineup leagues if you plan far enough ahead.

Additionally, it only will make sense in certain scenarios.  Review your league standings to determine if you have points to gain in wins and strikeouts.  Weigh these potential points against any possible lost points if you suffer a bad ratio day (ERA, WHIP).

Thankfully it is much more difficult to move ratios significantly this late in the season.  In fact, if you have enough cushion in ERA and WHIP, consider only picking up strike out specialists, regardless of their ratios.

You need to carefully approach the innings limit first.  Be cautious not to accidentally go over before you can take full advantage of this.  I would recommend trying to get within 10 IP of the full limit.  Getting any closer could be dangerous.

Avoid a Backfire

Perform this strategy as close to the end of the season as possible.  Many managers won’t be aware of this rule and doing it too early will allow others to recognize what you are doing and open you up to a similar response, wiping out the advantage you created.  Further, you may be dropping some very good pitchers in order to pick up streaming candidates.  Trying this before the last several days of the season will allow opponents to pick up these very good players and potentially use them.

Don’t Believe Me?

Check out the rules web pages for your league host below.

Yahoo!

loophole2

ESPN

Note that ESPN has a games started limit, not an innings pitched limit.  But the same principles apply.

loophole1

CBS 

loophole3

Conclusion

This is an easy tactic to employ and you’re leaving points on the table if you don’t try it. Granted, it doesn’t make sense if you stand to lose points in ratios or if you face keeper-league ramifications.  But if you could use an extra 20 strikeouts and a couple wins, you can’t go wrong.

Make smart choices.

Are you following me on Twitter?

Case Study: How To Assess Your Rotisserie League Standings

The case study below looks in detail at how to perform a review of your league standings.  This specific case study is written from the perspective of performing this review in late August, but reviewing and assessing your league standings is a valuable exercise to perform at any point in the season.

This review will guide the moves you make throughout the season.  It’s absolutely critical to have an in-depth understanding of the league standings.  This is not a simple exercise.  It will take time.  But that’s exactly why it’s advantageous and why it can be an advantage for you.

It’s Late August.  You’re In The Middle Of The League Standings.

How many rotisserie points can you legitimately expect to gain in the standings at this point of the season?  If you think you’re out of it, or don’t think you can catch the leaders because you’re in fifth place, I’d encourage you to take a closer look.  You might be surprised at how significantly things can still change.

The Standings

For the rest of this case study, assume the standings shown in the table below.  Let’s look at things from the perspective of the team in fifth place, E.A.B.O.D.  Does this team have a chance to catch the leader?

The first thing worth noting, besides the fact that I play in a nine team league (I’ve been trying to tell you I’m just a “regular guy”), is the first place team has a sizeable lead over the rest of the pack and sits at 68.5 points.  Then things are tightly bunched with four team near the mid-50s.

Standings1

This Is Just A Battle For Second PLace, Who Cares

We’ll take a look at if catching the first place team is possible in a moment.  But even if this is just a four-team battle for second place, taking this battle seriously, applying a well-devised strategy, and making a full-fledged effort to pass the current fourth, third, and second place teams is a valuable exercise.  What if next year it’s a four-team race for first?  Or even a two-team race?  If you’re able to win a four-team race over the last month of the season, next year’s two-team race will seem simple.

I got the idea for this case study while listening to Todd Zola on the August 9th edition of the BaseballHQ Radio Podcast.  His point was that it really doesn’t matter what place you are in the standings.  The exercise of going through a review of your team and the league standings in order to gain a few points is great practice.  Always seek to improve your team.  You’ll learn a lot from these seemingly unimportant battles.

Let’s Take A Closer Look

Remember, with roughly one month to play, we currently sit in 5th place at 52 points.  If we are to somehow pull this miracle off, we would need to reach 69 points, meaning we must somehow climb 17 points in the standings.

The best way to figure out how many points are possible?  Go category-by-category through the standings and figure out what points can easily be earned and those that could be earned with a little luck.  It’s also worth looking at the categories in which we could lose points (easily or due to bad luck).

Starting with runs, we’ve got a total of 830 runs to this point in the season.  Trying to be realistic about how many runs can actually be made up in about one month, we’ll say making up one run a day is possible, but not likely.  More likely, making up 15 runs over the next 30 days is a realistic possibility.  So anyone within 15 runs of our 830 total can be caught, giving us another rotisserie point.

Looking at the actual standings below, only one team is between our 830 runs and the attainable 845 (that’s SpartyOn with 841).  One additional team, The Naturals, is within 30 (at 857 runs to our 830).

Standings2

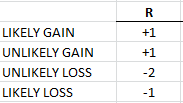
So that’s one standing point we can realistically gain (catching SpartyOn) and one more we could possibly gain, but it’s unlikely (The Naturals).  Note, if you’re also concerned about being caught in the standings, tracking the points you could potentially lose is another valuable exercise.  There is one team hot on our tails, with 827 R, and two others within 30 runs (805 and 802).

Summarizing the points we could gain or lose:
Standings13

Now extend this exercise out to the remaining hitting categories.  We’ll say anyone within 12 HR can realistically be caught and within 20 could potentially be caught.  Within 15 RBI can legitimately be caught and 30 RBI is possible but unlikely.  10 SB can reasonable be caught, 20 would be possible but unlikely.  And within .003 BA points can be caught, .006 would be possible but unlikely.

Standings3

Pitching Is A Little More Complicated

This particular league happens to have an innings limit of 1,550 innings.  Innings can be manipulated more easily than games played by hitters.  A team could theoretically start streaming a multitude of pitchers and easily increase innings in the short-term, whereas the limited number of lineup spots and days off for hitters prevents you from increasing at bats in the short-term.  This leads to potentially distorted pitching standings.

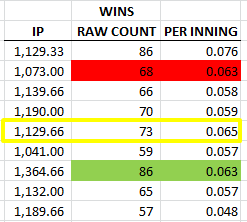
Look at the current standings below.  Take for instance, The Heat in seventh place.  The team is clearly ahead of everyone else’s pace for innings pitched and will hit the 1,550 cap soon.  The 1,185 strikeouts in 1,364 innings isn’t nearly as impressive as the 1,145 strikeouts the Warriors (eighth place) have in 1,132 innings.  The Warriors need only 40 strike outs in the next 200 IP to catch The Heat.  So we have to take the innings pitched distortion into account.

Standings14

The innings pitched distortion can only affect raw counting stats like W, SV, and K.  Pitching more or less innings can’t directly affect rate statistics like ERA and WHIP.

Looking more closely at wins, we can calculate the rate at which teams are earning wins by dividing wins by total IP.  This gives us “Wins per inning”.  Granted, this is an odd statistic and it’s not useful for many things, but it will help us remove the distortion caused by teams simply having more innings pitched than others.

Our hypothetical team in this case study is highlighted in yellow with 73 wins, or 0.065 wins per IP.  Looking at other teams, we actually have a higher wins per inning than the team with 1,364 innings pitched.  Even though that team has 86 wins, we are earning wins at a faster rate (0.065 vs. 0.063).  Theoretically we can pass this team simply by continuing to start our current pitchers.  Once we get to 1,364 innings, we should have more than 86 wins.

The other team with 86 wins (in 1st place) can’t be caught.  We have nearly the same number of innings (1,129.33 vs. 1,129.66), but they already have 86 wins to our 73.  And because we are in third place for wins (86, 86, then our 73), there are no more points to be made up in wins.
Standings6

Continue reading “Case Study: How To Assess Your Rotisserie League Standings”

Trading Strategy – Take Advantage of Misperceptions

What’s done is done.  April, May, June, and July are behind us and we’re heading into the stretch run.  If you’re still able to make trades in your league, here’s a strategy you can employ to squeeze a little extra out of a deal or to get a player at a discount.

Leagues are going to be decided by what happens over these last two months.  Today’s standings are based upon the past, but they will only change due to the statistics that will be earned going forward.  

So as we stand here today, we only care about the future.  This sounds obvious.  You know this.  I know this.  But many owners are unduly influenced by the past, by year-to-date statistics.  It’s impossible to avoid a player’s accumulated season-long statistics.  Visit player X’s profile page online or watch their game on TV and you’re bombarded with graphics showing they have 23 HR, 72 RBI, and 8 SB.  

There’s an opportunity here.

PAST PERFORMANCE IS NOT INDICATIVE OF FUTURE RESULTS

That player with 23 HR, 72 RBI, and 8 SB could very easily be less productive down the stretch than a player that currently has 8 HR, 27 RBI, and 2 SB.  There are players out there that have depressed counting statistics at this point in the season.  Maybe they were injured.  Maybe they have underperformed.  Or maybe they weren’t in the Major Leagues all season.

This is an opportunity for arbitrage.  It’s about finding your own 23 HR-72 RBI guys (especially if you smell a decline coming) and swapping them for other teams’ 8 HR-27 RBI guys.

What To Look For?

If you have a tradeable commodity, a player with impressive accumulated statistics, target players that are due, or are already experiencing, increased opportunity. Additional opportunity can come in many shapes and forms.  It can come from being injured early in the season and now playing regularly.  Or being a bench player early in the year and being pushed into a starting role due to injuries.  Moving to a more valuable spot in the lineup.  Being traded to a more productive lineup.  Being called up from the minor leagues.

It is this opportunity you should be looking for.  Skills remain relatively constant.  But opportunity can change significantly in a short period of time.

On draft day, players thrust into starting roles see their value sky rocket.  They’re termed sleepers.  Everyone in the league battles for them.  When the same thing happens in mid-August, many managers won’t notice.  And if they do, they won’t react in the same rabid manner.

Give Me Names

Here are some examples of players that will have strong opportunities to play the rest of the 2013 season and have depressed counting statistics for some reason (due to injury or being called up during the year).  If you offer up player(s) that have been healthy and played all season in exchange for players like those from the list below, the perceived difference in counting statistics may allow you to earn a slight “discount”.

  • Aaron Hill
  • Brett Lawrie
  • Jason Heyward
  • Curtis Granderson
  • Giancarlo Stanton
  • Carl Crawford
  • Brad Miller
  • Bryce Harper
  • Austin Jackson
  • Nick Franklin
  • Wil Myers
  • Jonathan Villar

A Real Example

You’ll have to determine your team’s needs.  But look at the potential trade below.  To this point in the season, Leonys Martin has stolen 27 bases, good for 10th best in the major leagues.  Jonathan Villar has only been in the major leagues since July 22nd and stolen 11 already.

Granted, Villar could hit .200 and be sent back to the minors in a few weeks.  But you should easily be able to trade a Leonys Martin for a Jonathan Villar AND get something else.  Heck, you could get something significant and Villar might be a throw in.  If you’re trying to gain ground in the standings, this is the type of risk you need to take on.

AccStats1

Don’t Fall Victim

So what can you do if you’re offered a trade like this?  How can you properly evaluate the offer?

The answer is to be forward looking.  Consider completely ignoring the statistics accumulated to this point and use one of the free and reliable rest-of-season projection systems that are available.  These are updated each day and give you only the projected stats for each player going forward.

Conclusion

This won’t always work.  A skilled manager might be as disciplined and forward looking as you.  But many managers can’t help but be overly influenced by the past.  If you can combine the tactic above with other strategies to engineer a trade, you’ll be well on your way to pulling off a deal that can help you down the stretch.

Make smart choices.


Selling Pitcher Wins – Why and How

At this point in the 2013 season, the Detroit Tigers are 68-45.  The Los Angeles Dodgers are 64-50.  Max Scherzer has a 2.84 ERA and a 0.90 WHIP.  Clayton Kershaw has a 1.91 ERA and a 0.88 WHIP.  So these two pitchers are having phenomenal years and play on teams with similar won-loss records.  We could expect similar won-loss records for the pitchers, right?  You’re smart enough to know that’s not the case.

Scherzer is 16-1 and Kershaw is only 10-7.  In fact, 19 pitchers have more wins than Kershaw.  Heck, Joe Saunders has 10 wins, a 4.58 ERA, and a 1.50 WHIP.  All the while playing for the 53-61 Seattle Mariners.

Need another one?  In 2012, Cliff Lee started 30 games and went 6-9 for the 81-81 Phillies.  At this point in the 2013 season the Phillies are 52-62 and Lee already is 10-5.  In 2012 he had a 3.16 ERA.  To this point in 2013 his ERA is 3.11.

You Can’t Predict Wins

Of course, I cherry-picked these examples.  But they illustrate a very important point.  You can’t predict pitcher wins.  Wins are by far, the most unpredictable of any common fantasy baseball category.

Exploit This Knowledge

Most semi-experienced fantasy baseball players know wins are unpredictable.   But what other choice does a manager chasing a title with a weak score in the wins category have?  They’re faced with the choice of chasing wins or having blind faith that their fortunes will reverse.  This is an opportunity for you.

Look at your roster and see if you have any marketable players in the wins category.  Maybe you can offer a Tillman, Masterson, Lynn, or Latos and upgrade in more steady and predictable categories of weakness.  Or maybe you have an elite Scherzer, Wainwright, Zimmermann, or Verlander and can land an elite player in return.

What To Ask In Return

I love this article by Michael Salfino of Yahoo! where he outlines the pitchers who have been “unluckiest” in the wins category this year.

One strategy you could employ would be to trade a pitcher that has been “lucky” in wins (like a Scherzer) for an “unlucky” player (like a Strasburg) and ask for something additional in return.  Something like an upgraded hitter, a stolen base specialist, or a closer.

Look at your team needs and try to convert the unpredictable wins into a steady and reliable producer in your own category of need.

Follow the principles outlined by Fred Zinkie in “Smart Elsewhere #6“.  Review the league standings and see which teams can benefit the most from a few more wins.  Reach out to them and let them know that your “lucky” wins pitcher is available and may be able to help them climb in the standings.

Conclusion

You can trade away wins even if you don’t have a strong hold on the category.  This is all about converting a very fickle and volatile statistic into one that you can more reasonably predict.  Don’t chase wins.  Let others do it.

Be smart.

Test Yourself – Are You a Stat Chaser?

We’ve all been there.  A player gets hot and hits several home runs in a week or a rookie gets called up and goes 3-for-3 in his first game.  But one of the most dangerous things a fantasy owner can do is “chase” these stats.  When adding players, you don’t get credit for yesterday.

The challenge is to be ahead of the curve.  Pickup the players before the big opportunity comes.  Accumulate the good stats.  Sense when a turn has been made and bail.

The worst thing you can do is continually chase today’s “hot” player, hold him for the next two weeks when he does nothing, and then repeat the cycle.

This is extremely difficult to do.  It’s against human nature.  It makes us feel warm and fuzzy to pick up that hot player.  It’s stressful and fraught with uncertainty to pickup a struggling player that may soon come into opportunity.  How can we fight these urges and determine how well we do at this?

Look Back

Wouldn’t it be great if there were an easy way to look back at every player you’ve owned over the course of the year to see the statistics they earned for your team?  You could see if you’ve owned a bunch of players that performed well below their season averages.  Then you’re likely a “stat chaser”.

Or maybe the majority of players performed in line with the rest of their season statistics and you’re displaying the patience and foresight necessary to succeed at this game.  Regardless, a restrospective review of your players’ performances can indicate if a change is necessary or confirm you’re on the right track.

The Good News Is…

There is an easy way to do this (at least in Yahoo! and CBS leagues).  In Yahoo!, access the “Team Log” link on your page.  In CBS leagues, look up player stats and filter them to show “fantasy” stats, meaning those actually accumulated for your team.

How To View Accumulated Stats In Yahoo!

  1. On your “My Team” page, locate the “Team Log” link.
    retro1
  2. You’ll then be presented with the list of every player you’ve owned over the course of the season and the statistics they’ve accumulated for your team (Forgive the small images.  Click on pictures below to see a full-size image).
    retro2
  3. You want to see players with stat lines consistent to their season averages.  The rate statistics like batting average, ERA, and WHIP are easy to compare.  You’ll have to adjust counting stats for games played, at bats, or innings pitched.   If you stream pitchers or selectively start those on your team, you hope to see an ERA and WHIP below season averages (under the assumption that you’re cherry picking the good matchups).
    retro3
  4. You don’t want to see pitchers with stat lines well worse than season averages.  This indicates one of several things.  You’re either failing at selecting good matchups.  You overreacted to one or two bad starts, accumulating the bad stats and not having the patience to wait for the regression.  Or you’re unlucky.
    retro4
  5. Be on the lookout for stat lines like the one below.  They’re not necessarily problematic if done in the right fashion.  I will often speculate very early on a player that I think will soon come into a favorable situation or opportunity, hoping for a huge payoff.  For this approach, hopefully I’ll also see a handful of “hits” to offset “misses” like this one on Martin.
    retro5


How To View Accumulated Stats in CBS

The process to get these statistics on CBS’ website is a little more convoluted, but it’s not difficult to do. Continue reading “Test Yourself – Are You a Stat Chaser?”

Case Study: How I Increased Team Batting Average 30 Points

It was this article by Tristan Cockroft in early May that jolted me.  I was sitting in the middle of the overall rotisserie standings in my mixed league, but was last in batting average by over 10 points.

One of the main takeaways from Cockroft’s article is that if you’re in trouble in the batting average category, you need to recognize this and make changes earlier in the season to address the problem than you do for the counting categories.  This is because batting average is a ratio statistic in which the denominator of the calculation (at bats) continues to steadily grow as the season goes along.  It’s much easier to nudge the batting average 5 points in May than it is in August or September.

I Needed To Act

On April 24th I sat in last place with a .236 team batting average.  Pretty pathetic for a fantasy squad in any format.  At the All-Star break I’ve managed to raise the average to .266 and climb into 6th in the category.  Here’s how I did it.

Date Move Verdict
April 24 Before even reading Cockroft’s article, I made a key move that has really paid off.  Added Matt Carpenter.  Dropped Kyle Seager.  Win
April 28 Still hadn’t read Cockroft’s article.  Took a shot on a potential batting average stud.  Added Nolan Arenado. Dropped Andrew Bailey (he had just gone on DL).  Draw
May 2 Read Cockroft’s article.  I realize it’s time to start making some bold moves to address the problem.
May 5 I’m also last in SB.  Added Dee Gordon.  Dropped Ike Davis. Nothing to lose here.  If Gordon could have hit .220 and stolen bases he would have improved my team average simply by not being Ike Davis.  Draw
May 10 Dropped Wil Middlebrooks.  Added Norichika Aoki.  Win
May 16 Nobody wanted to believe in the hot start.  Couldn’t believe he was still a free agent.  Dropped Josh Rutledge. Added Josh Donaldson.  Win
May 27 Decide it’s time to cut ties with Dee Gordon.  Dropped Gordon.  Added Leonys Martin.  Win
May 28 My dearth of hitting is at least offset by riches in the pitching categories.  Decide I’m willing to overpay for hitting because of significant leads in pitching categories. Trade away Prince Fielder, Adam Wainwright, Mariano Rivera, and Hyun-Jin Ryu.  Received Miguel Cabrera, Brett Gardner, and Matt Cain.  Win
June 9 Painful to look at this one in retrospect.  Decide to go for more proven batting average and SB possibilities.  Dropped Leonys Martin.  Added Shane Victorino.  Loss
June 15 Still need SB too.  Dropped Norichika Aoki.  Added Nate McClouth.  Win
June 21 Still need average and steals.  Cain had started to turn a corner.  Still had a lead in pitching categories.  Traded away BJ Upton, Aaron Hill, and Matt Cain.  Received Hanley Ramirez and Hunter Pence.  Win
July 5 Realize my DL slots are unoccupied.  In preparation for their pending returns, dropped speculation pick of Johnny Giovatella and added Adam Eaton and Derek Jeter.  TBD

Other Items Of Note

It wasn’t just who was added and dropped that made a difference.  We are also constantly making the decision of who to keep.  Who you choose to hang on to, especially during their times of struggle, is just as important.  Here’s a list of players that remained on my team from April 26th to July 14th and their batting averages at those end points:

BattingAvg

Evaluating The Approach

Looking back, you might argue that this was really all based on luck.  And to some extent luck has played a very important role.  But there was also a concerted effort to accumulate strong batting average plays and also a few “lottery tickets”, many of which have paid off.  And in the end, that’s what fantasy baseball is.  Collecting a bunch of assets that we hope will pay off.

I was acquiring Miguel Cabrera for a .330 average and wasn’t expecting .360.  I’m didn’t expect Josh Donaldson to continue to hit over .300, but he seemed like an upgrade over Josh Rutledge.  I continue to look for more “tickets” in Adam Eaton and Derek Jeter, both potential batting average stars (especially in relation to what else you can find at this point in the season).

I made mistakes along the way.  I was in on Leonys Martin very early.  Too early to catch the recent hot streak, and not patient enough to wait around for it to play out.

In hindsight many of these moves seem obvious.  I swapped a bunch of players hitting below .240 and replaced them with guys having the potential to hit for much better average.  But in the moment, it can be difficult to make moves like this.  You want to believe in the potential of guys like Ike Davis, Wil Middlebrooks, and Josh Rutledge.  The key is in realizing when the detriment of a .240 average is outweighing the possible 30 HR from a Davis or 15 SB from a Rutledge.  Recognize when the .280 hitter that will only hit 20 HR is the better fit for your team.

Takeaway

If you have a lot of ground to gain in a category, a concerted effort and a series of thoughtfully guided moves, all carefully aimed at improving that weakness, is your best move.  These don’t all have to happen in a short period of time, but you must constantly be monitoring your team and your place in each category.  Make steady and continuous effort to address weaknesses.

Take chances.  Overpay, using categories of relative strength, if you have to.  Be diligent.  Be relentless.  To borrow and tweak a quote from Mark Cuban’s foreword in “The Extra 2%”, “No one move is likely to make a difference.  But collectively, those moves make the difference between winning and losing”.

Mistakes will be made.  But because you’re making a series of calculated moves that all have a relatively high likelihood of panning out, you will make progress over all.  The wins will exceed the losses.

Thanks For Reading

I know it’s taboo to talk about ones own fantasy teams.  But I believe this exercise was a helpful illustration of what it takes to make significant progress in the standings.

Stay smart.


Quick Tip: Keep Your DL Spots Occupied

Awhile back I wrote about “The Extra 2%” by Jonah Keri, in which he outlines many little strategies implemented by the Tampa Bay Rays that helped the team gain a competitive advantage and allowed them to turn around the struggling franchise.

The key in that sentence is the phrase “little strategies”.  “Big strategies” are obvious.  They work for a short period of time and soon enough everyone catches on.  But a conglomeration of “little strategies”, unlikely to be noticed or deemed worthwhile, can also make a tangible difference over time.

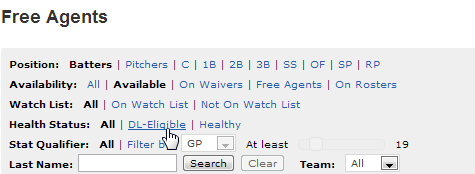
Enter a very simple tactic I always try to employ, but rarely see others use.  In a league with a specified number of DL spots, I always keep my DL spots filled.  This means actively monitoring free agents on the disabled list (ESPN has a handy feature that lets you see free agents on the DL).

DL

Who To Carry

There are almost always interesting names available.  This could be a struggling player off to an extremely slow start that went on the DL or a pitcher not expected to return from Tommy John surgery until August.  It doesn’t matter.

Try to target someone with potential.  Or someone who might be able to be traded later.  Or someone that fits a specific need on your team.  And if another more intriguing injured player comes along, grab that flavor of the month and stash him.

Why?

Why not?  If you’ve got a DL spot you might as well use it.  You can often hold a player in the DL spot even after they’ve returned from their injury, until you need to make another acquisition.  This can give you a week or so to monitor the player’s performance upon returning from the DL and weighing if they’re worth hanging onto.

It might not pan out.  You may simply end up cutting them in the end.  Or a legitimate player on your roster may end up needing to occupy the DL spot.  But this will give you the first chance to acquire the player.  You won’t be battling with others in the league, using waiver priority, or using FAAB to acquire someone.

It’s worth the risk.  There’s nothing to lose.

Go Check Your Waiver Wire

You might see names like Paul Konerko, Mike Morse, Lance Berkman, Brandon Morrow, Scott Baker, Colby Lewis, or Cory Luebke.  Stash them and see what happens.

Case Study: Ron Shandler’s Monthly League

If you’re not familiar with the name Ron Shandler, he’s been a legendary figure in the game of fantasy baseball.  He was one of the first writers to begin applying sabermetric-type thinking to fantasy baseball, he created the LIMA plan, founded BaseballHQ.com, and started the Tout Wars expert league.

And He’s At It Again

Shandler is experimenting with a new monthly league format.  One of the big selling points of the format is the ability to draft (or select) a new team each month.  Giancarlo Stanton, Curtis Granderson, Troy Tulowitzki, or Matt Kemp ruining your season?  The monthly format alleviates those concerns.  Multiple “draft days” during the season?  Sign me up.  Find a happy medium between the luck of weekly head-to-head formats and the marathon of a 162-game rotisserie format?  Perfect.

The Rules

Because of the All-Star break the contest will span five weeks.  Rotisserie scoring.  Players are selected based on a salary cap system in which salaries are assigned based upon production during the season to this point.

  • 30-team league
  • 30-man rosters made of 23 active players and 7 reserves.
  • Traditional rotisserie rosters – 2 C, 1B, 3B, Corner IF, 2B, SS, Middle IF, 5 OF, UT, 9 pitchers
  • 7 reserves can be any position
  • Salary cap is $300 for all 30 players
  • Players can be owned by multiple teams
  • 4×4 rotisserie scoring with the offensive categories of HR, SB, OBP, Runs Produced (R+RBI-HR, subtracting out HR removes “double counting” of RBI and R that occur on a home run) and pitching categories of W, Sv+Hld, K, ERA
  • No free agent pickups
  • Intra-roster moves (reserve-to-active and active-to-reserve) can be made twice weekly

The Player List

If you’re interested, the list of player salaries can be viewed here.

Thinking Through The Strategy

Because of the 30-team format, punting any category seems out of the question.  Stress needs to be put on forming a balanced team.  Being unable to pick up free agents means your team has to be constructed to absorb injuries that may arise during the month.

The ability to make moves twice a week looks like an opportunity to implement a pitching strategy.  You can’t gain much of an advantage in games played offensively, but it seems like carrying additional pitchers would allow for squeezing out a few extra starts over the month.  Alternatively, if one were to carry extra relievers with Save and Hold opportunities, you could implement a strategy of going after the Sv+Hld category while still being competitive in K and ERA.

After reviewing the rules, my strategy was to focus on building an offense with positional flexibility (to minimize the hitters necessary on my roster) and then use a volume strategy for accumulating pitching stats (more pitchers = more K and more Wins or Sv+Hld).

Finding The Value

In looking through the list of players, a number of “values” jumped out.  Players that have been injured or severely underperformed to this point in the season have extremely low values (Aaron Hill, Hanley Ramirez, etc.).

Realizing this, I needed a way to ensure I could identify all of the valuable players.  Simply combing through the list of 500+ hitters and 500+ pitchers isn’t reasonable.  I would surely miss someone valuable.

Building a Projection Tool

I used many of the principles and tactics outlined in the “Create Your Own Rankings” series.   Continue reading “Case Study: Ron Shandler’s Monthly League”

Young Players and Your Push For the Championship

Up until now, I’ve been led to believe that the reason Wil Myers hasn’t been called up to play for the Tampa Bay Rays is simply because of service time concerns and an attempt to maximize the Rays’ control of Myers before he can become a free agent (delaying a call up until after a certain point of the season may allow a team one more year of control over a player before free agency).

I’ve even heard it said that it seems like the Rays are willing to sacrifice an opportunity to win now, while they still have David Price (who will be a free agent after the season), just to get this extra year of service out of Myers.

But maybe It’s not Really About Service Time

On the June 12th edition of his Baseball Tonight podcast, Buster Olney interviewed Rays GM Andrew Friedman about Wil Myers’ development and the range of time when Myers’ could be called up, and here’s an excerpt of the response (the Friedman interview starts at about the 24 minute mark, the comments on Myers are around 33:40):

As much as we can continue that development while he’s there (in the minors) and not affecting us as we’re trying to win games is good. And that goes for any young player, I think. While we’re competitive it’s a little bit different in how we view our young players, and if we weren’t competitive we’d probably bring them up a little bit earlier. But it’s challenging in that we can’t just bring them up to the major league level to let them finish their development. ~ Andrew Friedman – General Manager, Tampa Bay Rays

Continue reading “Young Players and Your Push For the Championship”