I partnered Jeff Zimmerman (Fangraphs, Rotowire, Fantrax, multiple-time Tout Wars Champ) to write this comprehensive e-book guide (PDF) that outlines the start-to-finish process we go through during a fantasy baseball season. Please click here to buy The Process e-book.
How to Win Your League
The book is a chronological guide through the fantasy baseball season, with the main goal being to help you win your league. The topics covered are:
Use of Projections
How to Adjust Projections
How to Convert Projections to Values/Rankings
How to Adjust Values and Rankings
Draft & Auction Preparation
Draft & Auction Strategy
In-season Management & Strategy
End-of-season Management & Strategy
Wrapping Up the Season
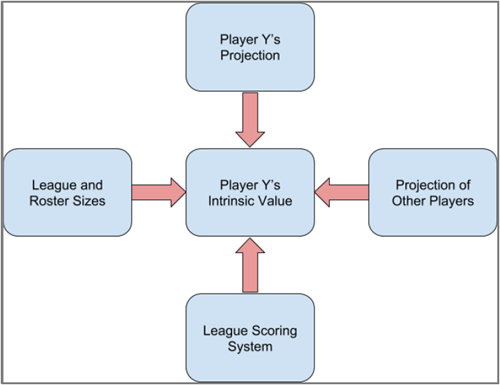
Player valuation and how it is determined are big themes in the book.
As you read through that list, you may be thinking, “I already know that topic,” or, “What more could be said about that?” But that is what I’m most proud of. I think we managed to provide unique perspective, insights, and studies that have not been seen before.
If you’re not an experienced owner and you’re looking for a place to start, The Process can help you too. It is a comprehensive guide, but we also present shortcuts and alternate ways of doing things. You can pick and choose the topics or areas in which you want to expand your game. Adding one or two new strategies or tactics to your own process each season is a great way to improve over time.
I’m also very proud of the way we were able to weave in a lot of theory, so owners are not just presented with a way of doing things, but can also understand the “why”, so it can be applied to similar situations in the future.
Cognitive biases and other decision-making concepts are also sprinkled throughout the book. We believe this combination of process, theory, and decision-making tactics makes The Process a unique tool for fantasy owners.
Tell Me More About What’s Included
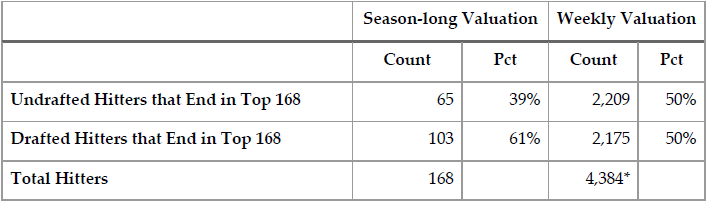
One of the more interesting studies included in the book is around the concept of weekly player values. Much of the research and decision-making fantasy owners do centers around annual valuations for players. Yet outside of draft and hold leagues, we don’t make decisions on an annual time horizon. Most owners must make decisions on a weekly or even daily basis. A study of weekly player valuations sheds light on how well we capture value in the preseason, what kinds of players create weekly value, and when new value appears during the season.
This table is one of many in a study of how well fantasy owners do at capturing weekly hitter and pitcher value.
The book also includes average standings data and standings gain points calculations for many popular league variations. Save hours of time having to calculate these yourself!
Example AL-Only OBP Average League Standings Data
This data is provided for the following league types:
15-team, Standard League (14 hitters, 9 pitchers)
15-team, 1-Catcher League (2 utility hitters)
15-team, OBP League (instead of batting average>
15-team, Draft and Hold League (no in-season pickups)
12-team, Standard League
12-team, OBP League
12-team, AL-only Standard League
12-team, NL-only Standard League
12-team, AL-only OBP League
12-team, NL-only OBP League
What Do Others Have to Say?
You don’t just have to take my word for it. Some of the minds I most respect in the fantasy baseball community have taken the time to read the book and offer their feedback (Rob Silver, Rudy Gamble, Eno Sarris, Mike Podhorzer, Mike Gianella). You can see what they had to say here.
Please Click the ‘Buy Now’ Button Below to Purchase the e-Book for $17.99
After clicking the “Buy Now” button, you’ll be taken through an online checkout process using PayPal. There is also an option to pay with a debit or credit card. After completing the purchase, a link to download the PDF book will immediately be e-mailed to you. You can read the PDF on any mobile device, PC, or tablet.
Click here to see a list of participants The Great Fantasy Baseball Invitational. I’m in League 13.
I recently participated in my The Great Fantasy Baseball Invitational (TGFBI) draft, which, if you’re a Twitter user and follow anyone in the fantasy baseball landscape, you could not have avoided. I do want to share with you some observations I had during the draft, but similar to my other writings, the goal here is to give some actionable advice (even if you’re reading this in the future) and not get too hung up on my team and specific players.
The Context
The invitational is made of 13 separate 15-team leagues. Each of these leagues will compete like any traditional rotisserie league and crown a champion within that league. The twist is that there is also an overall competition across the 13 leagues, whereby all 195 teams are competing in one massive rotisserie competition to crown an overall champion (similar to how the NFBC works). The one person that emerges atop 194 other experts can surely claim to be one of the best fantasy baseball players around.
This is the inaugural year of the competition, but it’s such an innovative idea that there’s no shortage of well-known folks competing. You can see the full list of participants here.
I’m participating in League #13. I happen to be the last name on the roster of the last league! What does that tell you, ha! You can see the draft results here. I was picking from the fifth spot.
My Feelings Going Into the Draft
While I’m obsessed with fantasy baseball, I really don’t view myself as anything special in this arena. Sure, I’ve MacGyver’ed up some neat spreadsheet tools over the years. But I don’t view my preparation process as anything special. I DON’T DO ANYTHING YOU’VE NEVER HEARD OF BEFORE. I’m not holding back any secret tricks of the trade.
And because I don’t do anything special, I was nervous as hell heading into this draft. I joked a few paragraphs back about being the last name on the last league. I don’t really know if that’s indicative of anything, but even if it is, I get it! I don’t even think I’ve written five legitimate articles in the past two years. It wouldn’t surprise me if that’s the lowest output of any participant involved. Meanwhile, many of the others are busting their backs to write articles and create podcasts on an aggressive and regular schedule.
These guys and gals are painstakingly combing over StatCast data, spin rates, hard hit rates, launch angles, swinging strike rates, and more… Meanwhile, I pretty much just let them do the work, read their articles, listen to their podcasts, plop some projections into a spreadsheet, make some manual adjustments, and I’m ready to rock with a comprehensive list of players and expected earnings dollar values.
Alright. Enough about me. Let’s try to make this useful. I apologize if some of what follows comes across as inflammatory or soap-boxy. Not everything can be sugar-coated. Here are my top lessons learned and observations after participating in this draft.
#1 – Exploit the League Rules
I really, really, really didn’t want to start with this one. It’s what EVERY SINGLE introduction to fantasy sports article ever written in the history of the world has started with.
So you would have expected that every one of the 195 participants would have done this, right?
But guess what??? I’m speculating, but I’d bet less than half of the TGFBI participants gave the rules a worthwhile look (I do realize saying “the TGFBI” is probably redundant, but it looks too weird not to do it). They probably assumed we were playing by prototypical standard rules and just checked to determine if we were using batting average or on-base percentage. But there are two rules we are playing by that are not exactly “standard” and each was something that I think needed to be known going into the draft. These two rules should have affected your behavior in the draft, and possibly in a significant way. Those two rules are:
Starting rosters include only one catcher but two utility spots
Rosters allow for five reserves and up to five DL spots for injured players
Pretty simple stuff, but small differences in rules, like starting one catcher instead of two, can have a significant effect on player valuation.
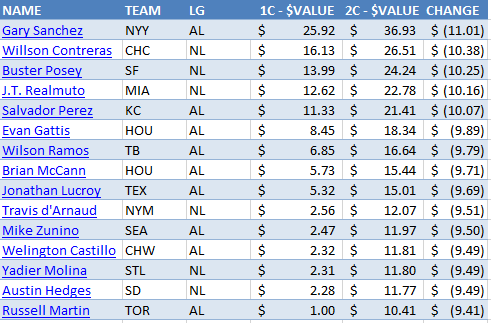
Why does this matter? In a 15-team league, I show the effect of going from two starting catchers to one as having around a $10 swing in value! That is an ENORMOUS detail (Note: the values in the image reflect the change from 2 C & 1 UTIL to 1 C & 2 UTIL, not just the move to 1 C).
The fact that this change is so significant surprises some people. But these are the same objective calculations that tell me Mike Trout, Trea Turner, Jose Altuve, Chris Sale, Clayton Kershaw, and Max Scherzer should be the highest valued players for the 2018 season. This isn’t speculation or “feel” about how to adjust for position scarcity. If you want to read more about the reason for this, here’s an illustrated example I put together from a few years ago.
As some of the faster drafting leagues started to get into the second and third rounds, we saw the big name catchers start to go. Then word quickly spread over Twitter, “This is a one-catcher league.” The effect quickly kicked in and the catchers starting plummeting. I’m a little disappointed this had to spread like a juicy rumor. I’d have expected everyone to know this going in.
I also suspect that many folks were worried the rules allowed for five reserve spots and no recourse for injured players. I believe this is how NFBC leagues and Fantrax leagues that allow for transactions operate (e.g. NFBC Main Event). I don’t have hard evidence to support this claim, but it just seemed like injured players like Michael Brantley, Michael Conforto, Jimmy Nelson, and Alex Reyes were going later than they should have been. My guess is they’d have been pushed up draft boards aggressively had everyone known this.
Small tip here. I don’t mind pushing up these injured players when you have a realistic way of replacing them that won’t burden you (force you to keep dead weight on your roster). Not only do you secure a talented player at a discount, you get the added benefit of being able to take chances on the waiver wire early in the season, when the odds are higher that you’ll be able to find a hidden gem.
My takeaway here is to not take anything in the rules for granted. Comb over them. Think about what the wrinkles in the rules might allow or incentivize you to do. Tailor your rankings and calculate your dollar values with these rules in mind. And don’t assume your enemies are doing the same. This can be an edge.
#2 – Use Dollar Values Tailored to Those League Rules to Make Decisions
My stance on this is simple and straightforward. If you’re not drafting with a set of projection-based dollar values in mind, you can do better.
I don’t care if you calculate them yourself, if you use the Fangraphs auction value calculator or the Rotowire custom dollar values, or if you buy a piece of software that does it for you… You’re not optimizing your chances of winning if you’re not drafting from values. You need a framework for comparing two hitters to each other, for comparing a hitter to a pitcher, and for making educated decisions. This is what dollar values do! Without dollar values, you’re being subjective. You’re letting biases creep into your decision making.
I don’t know exactly how every analyst drafts, but based on following folks on Twitter, reading certain sites, and discussions I’ve had with people, I’m pretty certain these folks all do value-based drafting:
Most of the concepts used in the standings gain points process of valuing players are straightforward. If there’s one facet of the process that causes the most confusion, it’s the handling of ratio statistics like batting average and WHIP. In the piece that follows, I’ll revisit the basics of what makes ratios statistics different and then I’ll get into two very specific and more complicated questions I often see.
How do you determine the baseline (or league average) ratio to compare the player pool to?
What if you don’t use an accurate measure for that baseline?
A player cannot hit a “negative home run” or “lose strikeouts”. Each counting stat helps you move closer to the next team in the standings. So when we are calculating SGP for a player, the counting stats all evaluate out to a positive number. For example, if we determine based on 2017 standings that it takes 8.526 home runs to move up one spot in the standings, Dee Gordon’s two home runs still calculate out to 0.2346 standings gain points. They’re still beneficial in an absolute sense.
Ratio Stats are Messy
When it comes to rotisserie scoring of ratio stats, we are not judged in that same manner. A player with a poor batting average or a bad earned run average can lower your score within those categories. You can have negative ratios that cause you to lose points or fall in the standings. A player can have a negative SGP for a ratio category.
How Do We Calculate SGP for Ratio Stats?
NOTE: This part is a refresher. If you already have a general understanding of how this works, skip down to the next bolded heading.
If we assume a league of 12 teams and 14 hitters on each team (adjust for your roster size), that is 168 players (12 * 14). In the Steamer projections, the top 168 major leaguers are projected for an average of about 509 at bats per player.
This means the average team in this fantasy league will have approximately 7,126 at bats (14 players * 509 at bats). According to Razzball, the average rotisserie batting average in 12-team leagues was .267. This means the average team had approximately 1,902 hits (7,126 * .267). And the average player had 136 hits (1,902 team hits / 14 players).
To find the impact of Trout we need to remove one “average” player from the team and then add in Trout’s projections. We can do the same for Tulowitzki.
13 “average” players * 509 at bats = 6,617
13 “average” players * 136 hits = 1,768
Before I start getting into the intricacies of that process, it’s important to understand that the approach we use to calculate SGP for ratio stats is to find an individual player’s effect on that ratio stat for an AVERAGE team in the standings.
Here’s a closer look at how you would do this for batting average:
Step
Description
1.
You first need to know what your fantasy league’s average batting average was. In this example, let’s say it’s .267.
You then need an approximation of how many at bats it took to generate that average. In this example, I determined that 168 players (12 teams * 14 players per team) would average 509 at bats. (more on how this was determined later!)
4.
Using that information, derive the number of hits the average player had. Knowing the league average and the number of at bats, we can easily figure out that the average player would have had 136 hits (.267 * 509 = 135.9).
5.
Next, you extrapolate the 136 hits and 509 at bats per player to team totals. But not a full team of players. ONE LESS PLAYER THAN A FULL TEAM (PER YOUR LEAGUE’S SETTINGS). We’re trying to figure out what an average team looks like without the one player we’re trying to rank.
In this example of a 14-player roster, we’ll use 13 players (one less than a full team). This means the average team (minus one player) would have 1,768 hits (13 * 136) and 6,617 at bats (13 * 509).
It’s CRITICAL that these two numbers hold true to your league average stat. Notice that 1,768 divided by 6,617 is still .267.
6.
Then, you add in the projection for the player being evaluated and DETERMINE THE TEAM’S RATIO STAT WITH THAT PLAYER. Assume a player is projected for a .300 average on 200 hits and 667 at bats. The calculation would be:
= (1,768 hits + 200 hits) / (6,617 at bats + 667 at bats)
= 1,968 hits / 7,284 at bats
= .27018 AVG
7.
Finally, determine the effect of the individual player by subtracting the average team’s ratio (from step 1 above) from the recalculated team ratio with the player, then divide by the SGP factor.
In our example, this calculation would be:
= (.27018 – .267) / 0.0019
= 1.6737 SGP
Instead of using a player with a .300 average, assume we used a player that dragged the team average down to .264. For this player, the SGP calculation would be:
= (.264 – .267) / 0.0019
= -1.5789 SGP
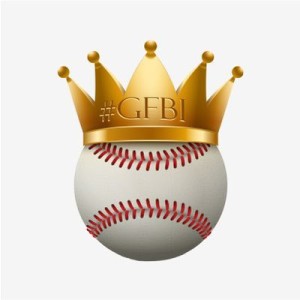
Negative standings gain points! I said this cannot happen with counting stats… But it CAN AND WILL HAPPEN with ratio stats.
How Do You Determine the Baseline (or League Average) Ratio to Compare the Player Pool to?
When you read through that description above, things generally make sense. But when you actually try to reperform that process, you’ll quickly realize I skipped some steps and take some liberties…
As much as I love the standings gain point approach to valuing players, it does have an a couple of inherent weaknesses.
First, it’s dependent upon some form of league history to work. The whole ranking and valuation process is derived from previous standings data! Those starting new leagues, or joining an existing league, don’t have this information available.
Second, assuming you have prior standings to draw from, I’ve always been bothered by the small sample sizes of that data. And I don’t know about you, but something odd always seems to happen in my leagues. One year someone runs away with it, one year it’s a tight race between five teams, one year we add two teams, the next year we contract a team.
Thankfully, some very generous league hosting sites have made their standings information publicly available or shared it with me! With their help, I think we can put to bed the concerns over lack of league history and small sample sizes. We have MANY leagues to look at now.
The fine folks at OnRoto.com have shared their NL- and AL-only standings data. If you’re not familiar with OnRoto, their goal is to cater to sophisticated fantasy leagues, many of which play by the “old-school” rules required by “long-term players”. They also are willing to fulfill just about any customization request (more on this later!).
I’ve also written several times about NFBC standings data for mixed leagues.
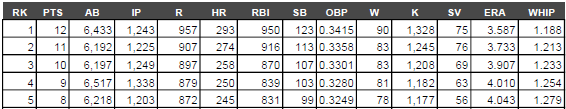
Here are the average AL statistics within each rotisserie scoring category:
RK
PTS
AVG
R
HR
RBI
SB
ERA
WHIP
W
K
SV
1
12
0.272
987
291
964
128
3.583
1.191
94
1,311
90
2
11
0.268
945
274
926
115
3.753
1.227
88
1,271
79
3
10
0.266
917
262
894
107
3.856
1.245
85
1,229
72
4
9
0.264
889
254
867
100
3.934
1.258
82
1,194
64
5
8
0.262
867
245
846
94
4.014
1.271
80
1,159
57
6
7
0.260
844
236
823
89
4.079
1.286
77
1,133
52
7
6
0.259
824
227
793
83
4.160
1.298
74
1,108
46
8
5
0.257
804
217
773
78
4.225
1.310
72
1,083
40
9
4
0.255
777
207
747
73
4.280
1.322
70
1,048
36
10
3
0.253
743
195
714
67
4.386
1.339
66
1,005
30
11
2
0.250
711
184
681
61
4.525
1.360
61
961
21
12
1
0.246
636
162
604
49
4.728
1.392
55
901
11
To better explain what you’re looking at, a team could have finished in 10th place in the standings but still finished 1st place in the home runs category. That team’s data appears on the “Rank 1” row, not on the “Rank 10” row.
I’m a little embarrassed about this. One of the reasons I started this site is because it aggravates me when people over-simplify things or fail to do proper analysis before making claims.
And I just did this myself.
What I Did Wrong
To fully understand where I went wrong, you should probably read Part 2 in my series documenting my DFS journey, “The Book and Addressing the Myths“.
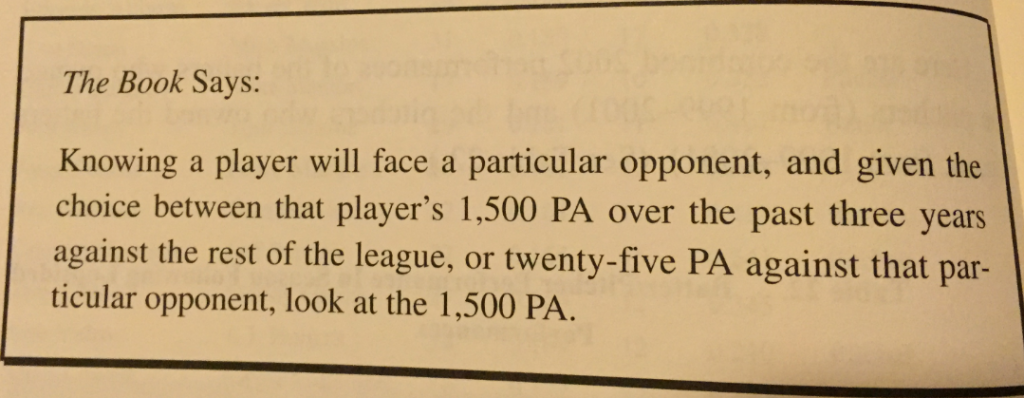
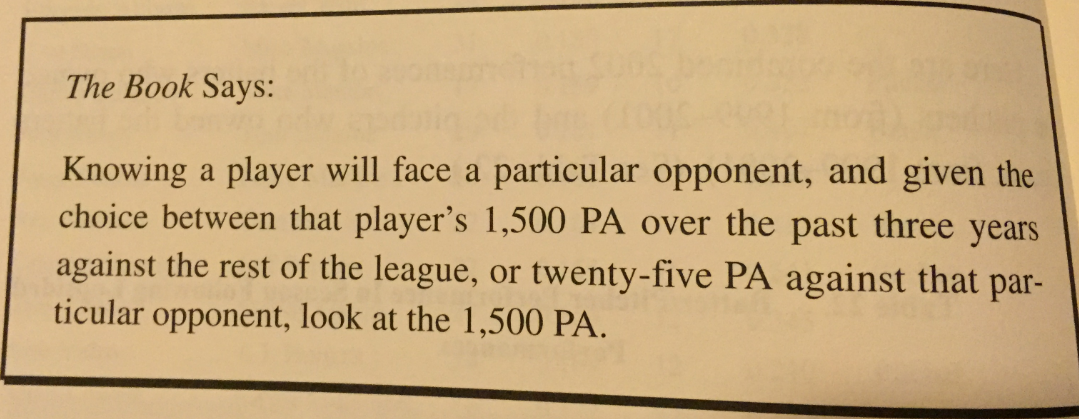
I read The Book. And it’s clear. It’s right there in black and white for all to see. Don’t use BvP to make decisions.
An excerpt from “The Book”, by Tom Tango, Mitchel Lichtman, and Andrew Dolphin
So what’s the problem?
It might help if we first take a step back. When we’re analyzing a particular baseball statistic (pick one), we often find that they’re not predictive from one year to the next. Take batting average for instance. We know that just because a batter hit .300 last year, it’s not a safe bet to count on that repeating itself.
What do we do in this case? We disaggregate the data. We break it down into other component statistics that we can much more reliably project. Instead of looking only at batting average, we’ll start to look at strikeout rate, walk rate, batted ball profiles, historical BABIP, and more.
I Should Have Done This with Batter-Vs-Pitcher Stats
I should have thought to disagreggate things. After all, just like I get along well with certain people and others make me want to drink bleach, some hitters are going to “have an edge” on certain pitchers and they’re going to be overmatched by others.
Not all pitchers are created equal. Not all hitters are created equal.
Whether it’s a batter’s swing path, a pitcher’s arm slot, a batter’s ability to go the other way, a pitcher’s level of deception, a batter’s inability to hit the down-and-in pitch, or a pitcher’s proclivity to throw a changeup in two-strike counts, there are many variables at play in a BvP matchup.
And it is VERY likely that these variables give an edge to the pitcher or the hitter. It’s VERY possible that one of these variables could put the odds overwhelmingly in one party’s favor. It’s also VERY possible that for every factor giving an edge to the hitter that there is an equal and offsetting factor giving an advantage to the pitcher.
It’s not that BvP is useless. It’s not that it has no predictive value. Certain hitters have an edge over specific pitchers. And vice versa. Of course they do. It just makes sense.
The problem is that we don’t know how to separate out the BvP matchups that are predictive those that don’t. Due to small sample sizes, when you go to break it down, BvP matchups probably fall into these nine buckets:
Bucket
Description
1.
Hitters with an edge over a pitcher, exceeding the expectations due to good luck
2.
Hitters with an edge over a pitcher, performing right at expectations due to neutral luck
3.
Hitters with an edge over a pitcher, underperforming the expectations due to bad luck
4.
Hitter with a neutral matchup against a pitcher, exceeding the expectations due to good luck
5.
Hitters with a neutral matchup against a pitcher, performing right at expectations due to neutral luck
6.
Hitters with a neutral matchup against a pitcher, underperforming the expectations due to bad luck
7.
Hitters overmatched by a pitcher, exceeding the expectations due to good luck
8.
Hitters overmatched by a pitcher, performing right at expectations due to neutral luck
9.
Hitters overmatched by a pitcher, underperforming the expectations due to bad luck
And just like when you combine a bunch of bright colors of Play Doh into one and end up with brown; when you combine all of these different buckets into one, you end up thinking that batter versus pitcher matchups don’t matter.
Welcome to the third part in my series documenting my journey of getting started with daily fantasy baseball. In the first segment, I did some introductory background reading. In the second segment, I took a look at some common statistics that you might be inclined to look at but that have been proven to be misleading (Batter versus Pitcher stats and players in the midst of hot or cold streaks).
The book is a tremendous resource if you’re like me and just getting started. I presume it’s also quite helpful even if you’ve been playing the daily game for a while.
If I’m being honest, you will save yourself a lot of time by buying his book instead of waiting for me to slowly process my own way through DFS and writing about it. Once you read Bales’ book, then come back to me to see how to implement the topics covered in an Excel solution. Bales has created an excellent beginner’s guide to daily fantasy baseball by giving you strategies, tools, websites, and outlining the exact information you should be looking at when generating lineups.
One topic I’ve seen mentioned in the book and repeated many times online is that to be successful at DFS you need to play the game regularly (“grind”) and as such you need to develop an efficient routine that allows you to create quality optimized lineups regularly. My hope is to use Excel (and maybe other technology tools) to do this.
My “Aha Moment”
There are two significant benefits I got from “Fantasy Baseball For Smart People”. The first is that it’s a convenient and complete package. You could probably get nearly all of the information from the book by reading through the various articles I linked to in Part 1 of this series. If you go that route you even get the information for free. But this book will save you time and puts them in a nice easy-to-use and convenient package.
As much as I love technology, I’m still a “book-in-hand” kind of guy. So I bought the paperback, which lets me dog ear pages I want to remember and reference easily in the future. There’s no easy way to do that with the 20-30 articles I linked to in Part 1.
The second big benefit I get from the book is an insight I did not see anywhere else in my prior readings.
The goal isn’t to maximize points (in your lineup), but to maximize win probability.
~ Jonathan Bales – Fantasy Baseball for Smart People
Maybe this is obvious to everyone, but it wasn’t to me. It’s a significant difference between season-long leagues and DFS.
I can’t envision a scenario in a season-long rotisserie league that you would not want to maximize your projected points in the standings. It’s a simple concept that having the most points in the standings gives you the greatest likelihood of winning the league.
But there’s an interesting wrinkle that I alluded to in Part 1 that changes things in DFS. Player selection is not mutually exclusive. I know, I know. There I go again using math words. This is a fancy way of saying that the players you choose for your team can (and inevitably will) overlap with players chosen for other teams.
Welcome to the second segment in my series documenting my own journey of getting started with daily fantasy baseball. In the first segment I did some introductory background reading, started to identify some analysts I can trust, took notes about research topics to focus on, and started planning features to be included in an Excel spreadsheet.
In this next segment we will take a closer look at some of the biggest myths that I’m seeing perpetuated out there.
I Can’t Believe We Even Have to Talk About This
I didn’t think I’d have to say anything like that until my daughters were teenagers… But here we are.
Just because you read something on the internet doesn’t make it true. We’ve all heard that before, right? I got up on my soapbox at the end of Part 1 and warned you to be careful out there… And here’s an example of why:
I would argue that BvPs are the most reliable out of all the sets we commonly use because they have the most amount of similar variables.
While it is wrong to accept BvPs as fact, it is equally wrong to discount their merit entirely.
BvPs are just one of the many things you should consider when building a roster but they are not the only thing.
Those are all from the same article talking about the merits of BvPs, or “Batter versus Pitcher” statistics. I promise you the article exists but I am not going to link to it. I’m not here to start fights. I merely want to point out that this misinformation exists, both in the form of online advice and it must also be a viable strategy in some DFS players’ minds.
Why Are You So Confident That BvPs Don’t Matter?
I can definitively say they don’t because it’s been studied by people much smarter than me. Studies using years and years of MLB data have been completed on this topic multiple times and have found that batter-vs-pitcher (or “BvPs”) information is not predictive unless you are talking at least a history of over 100 ABs between the two players.
So we have credible studies based on oodles of data performed by very smart people. Or we have baseless claims, anecdotes of individual examples, and Paul Goldschmidt’s numbers against Tim Lincecum on the other side.
If you find a study that suggest BvPs are meaningful, please let me know. But from what I have seen so far, it appears to be very irresponsible to suggest BvPs have value.
What Research Are You Referring To?
The main and most well known study I’m referring to is from “The Book” by Tom Tango, Mitchel Lichtman, and Andrew Dolphin. They studied “batters owning pitchers” and flipped it and studied “pitchers owning batters” from the time frame of 1999-2001. They identified players that “owned” other players during that three year span. Then they looked at what happened for those same players in 2002. In a very nice coincidence, in 2002 the hitters had 361 plate appearances against the pitchers they “owned”. And in that same season the pitchers had 361 plate appearances against hitters they “owned”.
The results were that the hitters had a wOBA of .349 against the pitchers they owned. These 30 hitters that were studied had wOBAs against those same pitchers ranging from .500 – .800 the two prior seasons. Then in 2002 they hit a combined .349, which is essentially league average.
And the pitchers that had dominated a group of batters allowed a wOBA of .343. Those 30 pitchers had wOBAs allowed ranging from below .100 to .210 from 1999 – 2001. Then in 2002 they too only allowed a league average wOBA against.
I’ve been playing rotisserie baseball for darn near 20 years at this point, but as I write this article, I’ve never before played a day of daily fantasy sports.
I’m generally familiar with the concept. I’ve read many strategy articles on the topic. But I’ve never put together an effort to dive in and develop a formal plan about how I’m going to attack this new game.
In this series of posts I will document my journey and the resources I’m using to get myself familiar with the game. I must repeat that I have never done this before. I can’t sit here and promise you daily fantasy riches. But my goal is to find a way to play this daily game smartly, efficiently, and strategically.
Be Careful. Be Smart.
I know we’re not playing poker here. But because I’m an ultra-conservative accountant that hates giving away money, I’m reminded of this famous quote from the movie Rounders.
I’m not about to jump in the DFS waters without getting a plan together. While there are probably a ton of new players jumping into daily fantasy baseball when the season starts, I know there are a lot of sharks swimming in those waters.
I can’t go in blindly. I can’t go in lazily. And I can’t assume my knowledge of baseball will be enough to win.
Many readers of this site probably know A LOT more about the topics and tools for this game than I do. I’m going to share the resources and articles that seem helpful to me, but I’m sure there are other (and better) resources out there. Please share those tools and resources you find most helpful in the comments below so we can all do this more effectively. And if you think I’m wrong in something that I’ve said or if I’m leading people in the right direction, let me know. Let’s have a cordial debate.
I’m excited and nervous… Let’s go!
How Have You Never Played DFS Before?
Good question. I suppose I should address this before we get started.
I’ve mentioned many times on this site before that I’m married and have two daughters, I work full-time, and try to run this site on the side. From what I do know about daily fantasy baseball, my impression is that it takes a good amount of effort and time to play effectively. I know that weather can be a big factor in games. Lineups may change late in the afternoon. And I work until 6PM EST most nights. I can’t get on many of the DFS sites at work. So if I get home at 6:30, that doesn’t leave much time to eat dinner with my family, set a lineup, check the weather, make late lineup swaps, etc.
So that’s the angle I’m operating from. I’m not only looking to learn the most effective ways to play. I also I need to find ways to play this game well in that environment. It might mean coming up with lineups the day before. It might mean finding services or apps that can notify me of lineup or weather problems. Or it might mean only playing on the weekends. I don’t know yet. But if I can’t find a way to play on a level playing field during the week, I won’t do it.
There has to be a way.
Prerequisites
A lot of the introductory material about getting started with DFS baseball assumes you come in without any advanced (or even moderate) knowledge of baseball statistics.
My first thought about that is it’s actually intriguing that there’s a need to explain some of those statistics. See the Matt Damon video quote above. Maybe I won’t be the sucker at the table.
With that said, I’m going to assume you know what FIP, K/9, wOBA, regression, and SIERA are.
I don’t mean that you can rattle off the exact formula for wOBA or even know the specific differences between SIERA and FIP, but just that you have a rough concept of what those terms are. If those terms are Greek to you, I might suggest digging around the Fangraphs Glossary for a while to acclimate yourself to the sabermetric terminology.
My Notes
I’m going to start on this journey by reading up on as much strategy as I can. I’m not talking about player-specific information. Just general strategies at how to win at this new game. I’ll try to summarize my findings here and then I’ll link to the articles I’ve read at the bottom of this post.
My notes are below. I want to reiterate that I am just compiling this information from the web and summarizing my thoughts. Credit for these original works goes to the authors mentioned later in this article.
Think of players like Ben Zobrist, Martin Prado, and Matt Carpenter.
In recent seasons, players like these have been eligible to play multiple positions. The big question is, “All else equal, should you pay more for a multi-eligible player than a player only eligible at one position?”.
I think there’s a clear answer to this question. And it might surprise you.
The Argument That They Are Not Worth More
Would you pay $2 more for Player A because he’s also second base eligible?
Player A (2B / SS): .272, 10 HR, 83 R, 52 RBI, 10 SB
Player B (SS): .275, 11 HR, 78 R, 55 RBI, 8 SB
Some very intelligent fantasy baseball minds will tell you that a player with multi-position eligibility is not worth more. For instance:
However, since playing more than one position doesn’t mean the player will produce any extra stats, he doesn’t have any greater an actual dollar value than someone who plays only one position.
If you haven’t read Schechter’s book, you need to. It is loaded with very clear and well-reasoned thoughts and strategies like this one.
When you read the book, it becomes clear that Larry has a very bottom line approach. If a possible decision ends up adding dollar value to your team, you choose that option. If there is no measurable benefit in dollar value, you don’t.
I love the approach. That’s why I think everyone should create their own rankings. Attaching dollar values to players makes all decisions systematically easier to make. You no longer have to agonize over decisions like, “Should I drop player X and add player Y from the waiver wire?”. It’s a lot easier to simply look at each player’s projected dollar value for the rest of the season and decide.
With that said, I think it’s a little short-sighted to only look at the dollar value of a player at a given point in time.
Let’s Play Cards
My wife says my analogies are horrible, but I’m going to try a few on you anyways. Before we get into specific scenarios involving fantasy baseball, let’s first consider a couple of card game examples.
Blackjack
We can probably agree that the ace is the most powerful card in blackjack. A big reason for this is that it’s a gateway to reaching the total of 21. Without an ace you need a combination of two cards to get to 11 or 21 (2 & 9, 3 & 8, etc.). But the ace gets you there in one card.
Another huge power of the ace is its ability to act as two different cards, a 1 or an 11. It’s an insurance policy. You can behave as if it’s an 11 and quickly change it to a 1 if you bust. It lets you take risks you wouldn’t otherwise take. Keep this in mind.
I’ll end the blackjack example with a question. Assume an 8 in blackjack could be used as an 8 or a 3. You get to decide. Would that make the card more valuable to you than a card that could only be used as an 8?
Poker
I’m not a poker guru but I played my share of Texas Hold’em games in the early 2000’s just like everyone else.
In my mind, a huge decision-making factor in poker is the number of helpful cards (or “outs”) left in the deck.
For example, if you have a pair of 9s, we know there are only two helpful cards remaining (the other two 9s) to help you make three of a kind.
Or maybe you have an open-ended straight like a 4, 5, 6, and 7. In this case there are four 3s and four 8s that would finish of your straight, for a total of eight “outs”.
If an average hitter is bumped from the sixth spot in the batting order to the two-hole, how much of a bump in performance can we expect?
I’ve written a little about this before. Mostly just suggesting that this is something to keep in mind when you’re looking for hidden value. And I always had in the back of my mind that when I finally got around to downloading all the retrosheet game logs for each season AND learned SQL that I could figure out exactly how much of a benefit this would represent.
Then my five-year old daughter starts playing soccer and is bringing homework back from kindergarten, my sister and twin sister-in-laws all decide to get married in a two-year period, work gets in the way… and before I know it those plans of teaching myself how to process game logs are out the window!
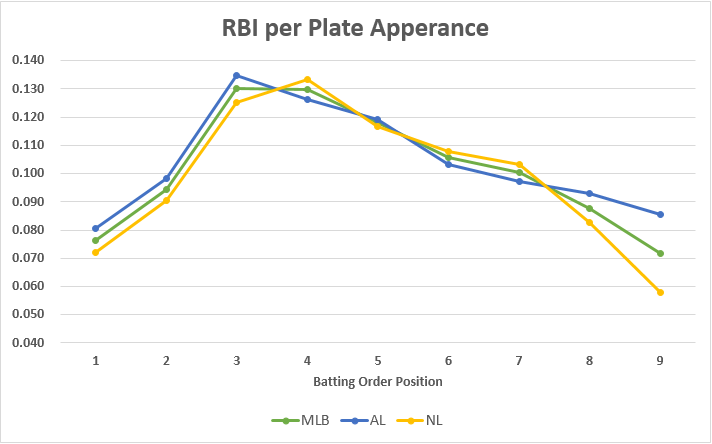
I have taken the 2014 data from Baseball Reference tweaked it some. You will first see a series of charts depicting the batting order splits for 2014. Then after the charts you will see tables showing the MLB, AL-only, and NL-only data.
I’ve added calculations for Plate Appearances per Game, Runs per Plate Appearance, and RBI per Plate Appearance.
These measures are all important inputs when I’m projecting a player’s performance (side note, if you are interested in projecting stats here is the approach I use). Knowing (or estimating) where a player will bat in the order affects the number of times they’ll come to the plate during the season. That spot in the order also affects their run scoring and run driving productivity. You’re more likely to score batting in front of the 3- and 4-hitter than you are batting seventh.
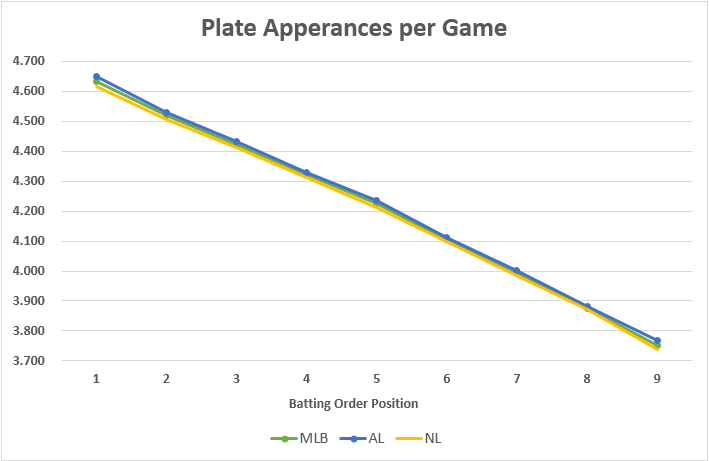
Plate Appearances
The graph below shows that for every spot a player drops in the lineup, they can expect to see about 0.10 or 0.11 fewer plate appearances per game. Over the course of a 162 game season that is about 16 plate appearances. Fall from second in the order to 7th, you’re looking at 80 less plate appearances.
Notice that there’s really not much of a difference between the AL and NL in terms of plate appearances for any spot in the lineup.
We use cookies to ensure that we give you the best experience on our website. If you continue to use this site we will assume that you are happy with it.