Now Available – The Projecting X 2.0 Bundle!

Projecting X 2.0 and the updated Excel template are now available!
Projecting X 2.0 and the Excel Template are now available!

Yes, that’s right. Mike Podhorzer has just released Projecting X 2.0. And I’m excited to announce an updated Projecting X Excel template has been upgraded to be more helpful than ever and has been updated to be consistent with all the new projection methodologies used in Projecting X 2.0.

NOTE: The Projecting X 2.0 Bundle has been updated for the upcoming 2017 MLB season.

What’s New in Projecting X 2.0?

While I would not consider version 2.0 to be a complete re-write of the original Projecting X, it’s certainly an improvement of the process, methods, and formulas used in the original book.

Don’t get me wrong, I love the Projecting X approach. But I did feel there were a couple of methods in the original version that I thought had room for improvement. For example, I’ve come to learn that using K% is superior to using K/9. And I thought the approach to projecting runs and RBI was too subjective.

Well, Podhorzer has addressed all of those issues, improved upon several of his methods, and even introduced new ones.

My favorite changes to the process are:

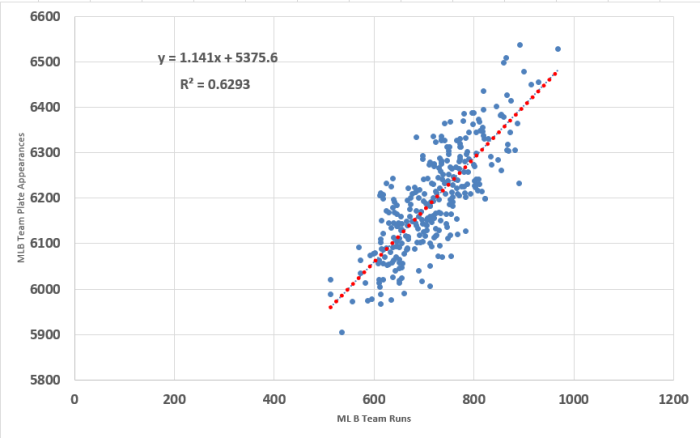
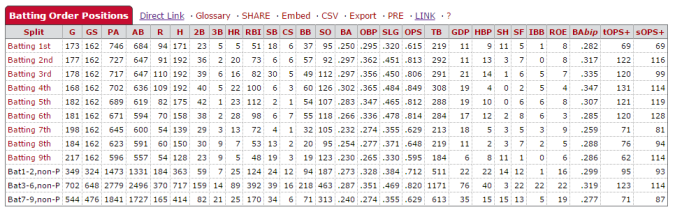
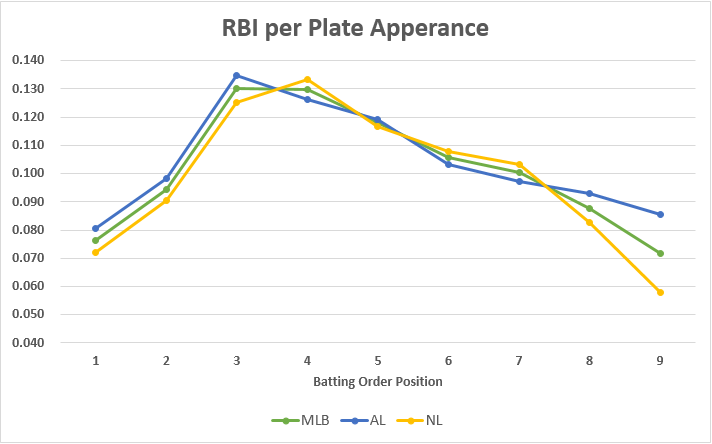
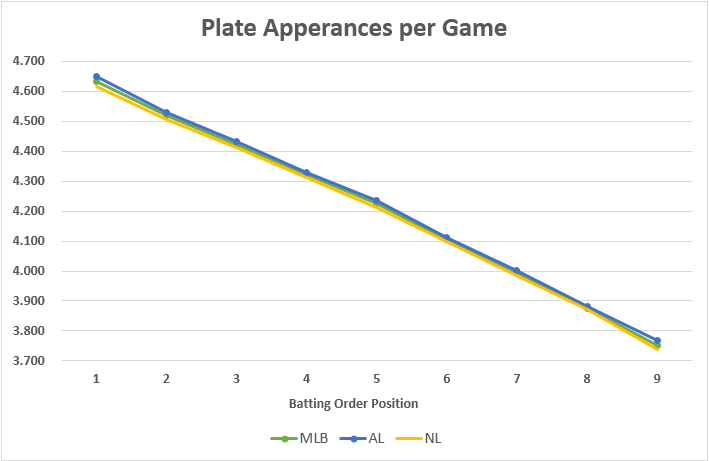
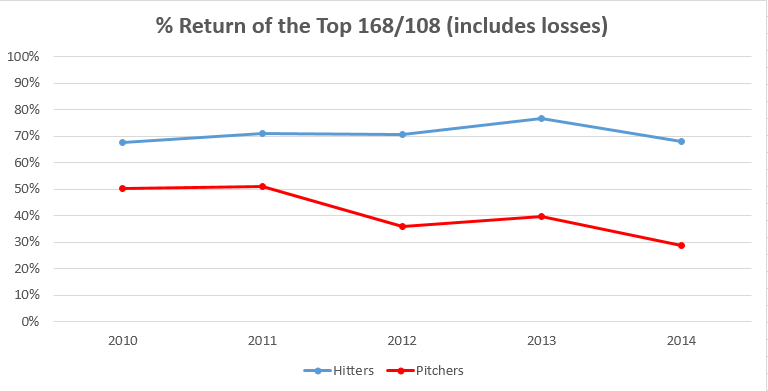
  • A much improved and more scientific methodology for projecting Runs and RBI
  • Switching from K/9 and BB/9 to K% and BB%
  • A method for projecting quality starts (I get asked about QS projections all the time!!!)
  • Addition of metrics like strike percentage (STR%), looking strikes (L/STR), and swinging strikes (S/STR) to pitcher projections, and
  • Revisions to the projection of stolen base frequency

What’s New in the Excel Template

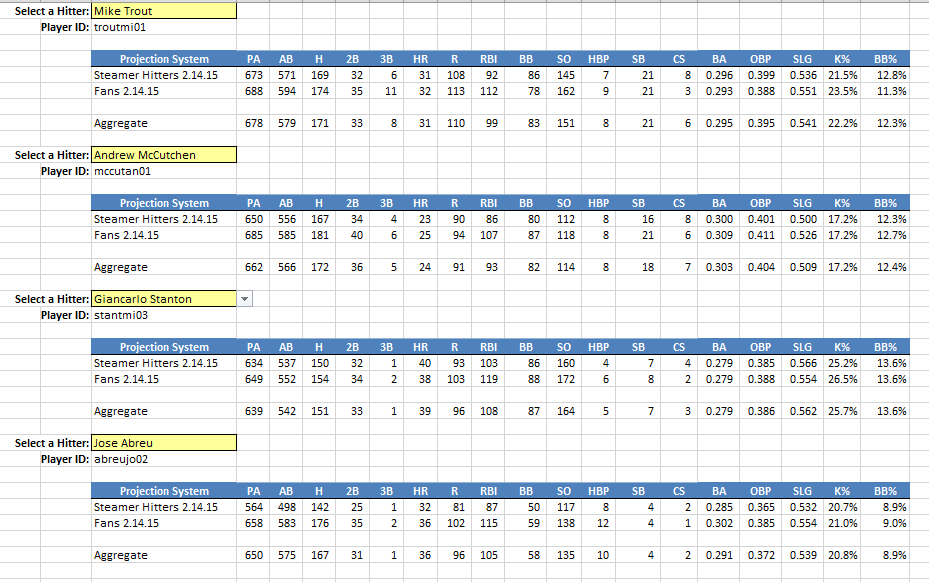
The Excel template has been updated to be 100% consistent with all the new methodologies and formulas used in Projecting X 2.0. Take a look.

If you’re a user of the Projecting X 1.0 Excel template, the biggest improvements in the file are:

  • Addition of career stats
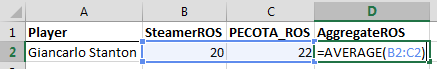
  • Addition of a customizable three-year weighted average
  • New team hitting and pitching totals that sum as you project
  • More league average information
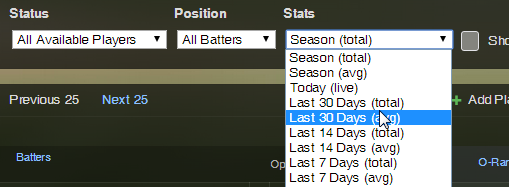
  • New links to Baseball Savant, Brooks Baseball, and RosterResource.com
  • It’s now easier to add a new player to the spreadsheet
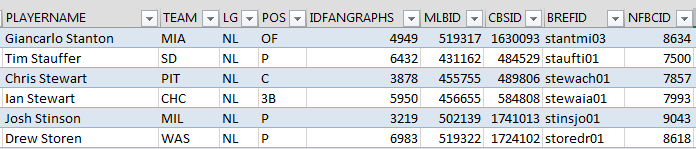
  • The Player ID Map is now easily refresh-able so that when I add new players or change player teams, this information updates in your spreadsheet too

Download the Updated Bundle Today

The updated book and spreadsheet are available for the bundled price of $17.99 (they separately sell for $9.99 each). Click the Add to Cart button below to begin the checkout process.

PDF (recommended) Buy Now
AZW3 (Kindle) Buy Now
EPUB (Nook, Apple iPad/iBooks, Sony Reader, Kobo) Buy Now
View Cart

Continue reading “Now Available – The Projecting X 2.0 Bundle!”

How to Project Plate Appearances

Projecting X Mike Podhorzer
Click here to create your own player projections.
Going through the process of projecting individual players is one of my favorite parts of the year. I started creating my own projections two seasons ago, using Mike Podhorzer’s book Projecting X.

There are parts of the projection process I feel very comfortable with. I can look at a player’s recent plate discipline, batted ball mix, and power ratios to arrive at an accurate projection for most of that player’s stat line…

But when it comes to projecting playing time, I feel like I’m throwing darts with a blindfold on. How can I realistically make a determination between 675 PAs and 690 PAs?

Until now, I’ve really just relied upon a player’s recent seasons and used qualitative information about injuries, role on the team, and playing time competitions to come up with an estimate for total plate appearances.

Thankfully, a reader of the site recently commented on a post I wrote about the effect of batting order on runs and RBI, and his question helped me arrive at the much more sound approach for projecting playing time I’m about to share with you. Here’s his question:

Interesting stuff. In your research, I am wondering if you happened to look at Team Runs/Plate Appearances on a per game basis?

That is, if a team scores Y runs in a game, what would you predict their Team PAs to be. Something like Y = Ax + B.

~DMM

That question got the wheels turning in my rapidly deteriorating middle-aged brain… There have to be better ways to think about playing time. And I certainly need to take the team’s overall run scoring into account.

Team Plate Appearances vs. Team Runs

To answer the question, I downloaded the last ten years of MLB team offensive stats from Baseball-Reference.com (click here to see the data).

Then I created a scatter plot in Excel by graphing team runs against team plate appearances.

TEAM_RUNS_VS_PLATE_APPEARANCES

I’ve mentioned it many times on the site already. I’m no statistician. I don’t play one on TV. And I’m not pretending to be one on the internet. I am squarely in the area of having enough knowledge about statistics to offer no help but to only be dangerous. With that amazing qualifier I’ll try to explain what you see in that chart above.

Each of the blue dots represents one team’s season in the last 10 years (2006-2015). For example, the dot in the top right corner is the 2007 Yankees, who scored 968 runs (holy crap, A-ROD!).

The dotted red line represents a trend line or line of best fit. It’s the best estimate of the relationship between team runs scored and team plate appearances. The equation on the graph is the formula used to chart out the red line and is the exact answer to reader DMM’s question (where x is team runs scored and y is team plate appearances).

y=1.141x+5375.6

I suppose that could be helpful at the daily game level too. That equation would become y=0.007x+33.18 if you were trying to project a team’s plate appearances in an individual game (where x is runs per game, not season-long runs).

Projecting Individual Plate Appearances

That answers the original question. But I still wasn’t quite satisfied with stopping there.

Sure, it’s helpful to know that if I think Angels will score 700 runs that I should project that whole team for about 6,175 plate appearances (5,375.6 + 1.141 * 700 = 6,174.3). But what does that mean to Mike Trout if I think he will bat second in the lineup? And what if I think he’ll bat third?

Is there a way to add a third variable to the chart above? So we can see how leadoff hitters on teams scoring 700 runs have fared? Or how cleanup hitters on teams scoring 800 runs have performed?

The Data

Baseball-Reference has a really interesting split table that shows the hitting stats each team had from each spot in the lineup (click here to see Kansas City’s 2015 team split).

Kansas City Royals 2015 team batting splits

I downloaded that split table for all 30 teams for each of the last 10 seasons (300 CSV files!). You can see all the raw data here. Again, thanks to Baseball-Reference for making this data available.

Then I grouped the data by team runs scored, putting teams into categories of 500-549, 550-599, 600-649, 650-699, 700-749, 750-799, 800-849, 850-899, 900-949, and 950-999 runs. Here’s a table showing the number of teams in each of these categories for the AL and NL:

Runs Scored AL Teams NL Teams Total
500-549 1 2 3
550-599 2 7 9
600-649 19 34 53
650-699 23 33 56
700-749 33 43 76
750-799 30 25 55
800-849 19 9 28
850-899 12 4 16
900-949 3 0 3
950-999 1 0 1

Continue reading “How to Project Plate Appearances”

Easily Combine Multiple Projection Systems

COMPARE_HITTERS

After over a year of working on this and getting feedback from a very helpful group of SFBB readers, the “Projection Aggregator” Excel file is finally ready!

The Projection Aggregator is an easy to use Excel spreadsheet that can combine (or average) up to three different projection sets to give you the best possible set of projections to use for the upcoming season. You can use just about any well known projection source you have at your disposal. Download your favorite projections, fill out some settings, and you’re done.

No complicated formulas. No VLOOKUPs. Just download your projections, bring them in to the Aggregator, and you’ll have better projections in minutes. Click here to find out more.

How Does a Player’s Age Affect Draft Return?

A few weeks back I took a closer look and analyzed the last five years of preseason Steamer projections (what I’m using as my best approximation of the “draft value” of each player heading into the season) and compared them to the actual end of season dollar values earned by those same players.

One of the glaring omissions in that article was some kind of analysis by age.  Are there certain age groups that might be undervalued?  Better yet, are there certain age groups of hitters we can take advantage of and a separate age group of pitchers we can jump on?

If we are trying to decide between a $20 pitcher who’s 23 years old or a $20 pitcher who’s 33 years old, who should we choose?

Quick Reminders

I’d highly recommend reading the first article that started me down this road.  There’s a greater explanation of the approach used.  But for a quick reminder… the dollar values are based on a standard 12-team league using traditional rosters (2 catchers, 14 hitters, 9 pitchers) and the standings gain points approach.

I also calculate return “including losses” and “without losses”.  The best way to think about this is with a pitcher suffering a terrible injury in the first month of the season.  Being injured that early, regardless of how good the pitcher is, will result in negative earnings.  But the “benefit” of an injured pitcher is that you can immediately drop them and not suffer any of those negative earnings.

The flip side of that coin is with a struggling pitcher.  You may decide to stick with a struggling pitcher for weeks or months, hoping for them to turn it around.  In this scenario you are saddled with many of the negative earnings for that player.  So the actual “return” on players lies somewhere between the “including losses” and “without losses” results.

Draft Results By Player Age

Take a look at the “Including Losses” and “Without Losses” charts below.  Does anything jump out at you?

RETURN_BY_AGE_WITH_LOSSES Continue reading “How Does a Player’s Age Affect Draft Return?”

The Effect of Batting Order on R and RBI Production

If an average hitter is bumped from the sixth spot in the batting order to the two-hole, how much of a bump in performance can we expect?

I’ve written a little about this before. Mostly just suggesting that this is something to keep in mind when you’re looking for hidden value. And I always had in the back of my mind that when I finally got around to downloading all the retrosheet game logs for each season AND learned SQL that I could figure out exactly how much of a benefit this would represent.

Then my five-year old daughter starts playing soccer and is bringing homework back from kindergarten, my sister and twin sister-in-laws all decide to get married in a two-year period, work gets in the way… and before I know it those plans of teaching myself how to process game logs are out the window!

Thankfully though, I stumbled upon the league splits page for the 2014 season at Baseball-Reference.com.  And it has the batting order splits already calculated for me!

Charts and Table Data

I have taken the 2014 data from Baseball Reference tweaked it some.  You will first see a series of charts depicting the batting order splits for 2014.  Then after the charts you will see tables showing the MLB, AL-only, and NL-only data.

I’ve added calculations for Plate Appearances per Game, Runs per Plate Appearance, and RBI per Plate Appearance.

These measures are all important inputs when I’m projecting a player’s performance (side note, if you are interested in projecting stats here is the approach I use).  Knowing (or estimating) where a player will bat in the order affects the number of times they’ll come to the plate during the season.  That spot in the order also affects their run scoring and run driving productivity.  You’re more likely to score batting in front of the 3- and 4-hitter than you are batting seventh.

Plate Appearances

The graph below shows that for every spot a player drops in the lineup, they can expect to see about 0.10 or 0.11 fewer plate appearances per game.  Over the course of a 162 game season that is about 16 plate appearances.  Fall from second in the order to 7th, you’re looking at 80 less plate appearances.

Notice that there’s really not much of a difference between the AL and NL in terms of plate appearances for any spot in the lineup.

PLATE_APPEARANCES_PER_GAME Continue reading “The Effect of Batting Order on R and RBI Production”

Analyzing the Last Five Years of Rotisserie Baseball Drafts

How many of the top hitters and pitchers at the end of the year were actually drafted? How many of the top hitters and pitchers were not drafted and were picked up during the season?  Were hitters or pitchers drafted more accurately?  What is the dollar value earned by the players that were picked up during the season?  Is there a position of hitter that’s more reliable than other positions?

Have you ever asked yourself draft analysis questions like these?

What follows is a five year analysis (with colorful graphs and an enormous Excel file!) of how accurately our projections in the preseason depict what has actually happened at the end of the season. How well we drafted.  What positions yield the best returns.  What positions offer the most free loot.  And more.

Assumptions You Should Know

A number of the graphs depend on dollar value earnings for the “top 168” projected hitters or “top 108” projected pitchers.  The dollar values are calculated using the approach documented in “Using Standings Gain Points to Rank and Value Fantasy Baseball Players” assuming a 12-team league, $260 team budget, 14 hitters (C, C, 1B, 2B, SS, 3B, CI, MI, OF, OF, OF, OF, OF, UTIL), 9 pitchers, and a 70%-30% hitter-to-pitcher allocation.  That’s a total of 168 hitters and 108 pitchers.

These top projected players in the preseason were determined using Steamer’s preseason projections for that season (I downloaded the historical projections here).

I suppose using ADP results or expert rankings from the given year might give a better picture of the players that were actually drafted, but then you get into the question of what’s good ADP data, where to get it, what experts to use, league differences, lineup differences, etc.

To Be Clear…  The Goal of this Study

The goal of this is not to measure the accuracy of particular experts.  It is to determine which positions can we draft and get the most return on our investment.  To some extent this is a review of Steamer’s accuracy, but that’s also not my intent.  It’s my understanding (tell me if I’m wrong) that there are not significant differences between the top projections systems.  So whether we were looking at PECOTA, Steamer, or Marcel projections, we would see similar results.

How Much of a Return Do We Get For Drafting HItters vs. Pitchers?

People have long been telling us to, “Load up on hitters early in the draft”.

“Don’t overspend on pitching.”

“Wait on pitching until most teams already have one.”

I’ve always heard these things.  They sounded right.  But I can’t say I’ve ever seen the data to support it.

In looking at the chart below it is very clear that we are much better at identifying the top hitters than the top pitchers.  The top 168 hitters in the preseason provide about 70% of the dollars earned at the end of the season.  For pitchers, it’s more in the neighborhood of 40%.

With results like that it’s very easy to see why the hitter-pitcher split is not 50-50.

Hitters are safer investments than pitchers.  We’ve always been told this, but now you can see it.  And things have not changed in the new era of pitching that we’ve been seeing the last few years.  If anything, the gap seems to have widened.

Hitter-Pitcher-Draft-Returns-With-Losses
In a draft and hold environment, the return on investment for drafting hitters fluctuates between 65% and 80%. The return on pitchers is much lower, falling roughly between 30% and 50%.

Continue reading “Analyzing the Last Five Years of Rotisserie Baseball Drafts”

The Difficulty In Aggregating Projections

Now that we’ve established that we can benefit from combining multiple projection models into one, let’s take a look at the challenges this presents.

I’ll also give brief explanations of how you can work around these challenges in Excel.  At the end I’ll discuss an Excel template I’m working on that will do these calculations for you automatically and how you can get your hands on it.

I love Your Feedback

If you’re a SFBB Insider you might recall that after you sign up, the very first e-mail I send you asks you to reply with any fantasy baseball topics you’d like to know more about or difficulties you’re having (if you’re not, you can register here.  I like to think it’s worth your while).

Insider

I Read All Of Those Responses

I’ve been fortunate enough to have nearly 500 people register, and I read every single response that comes in from that question.  One of the most frequent areas of interest is how to average, or aggregate, multiple sets of projections into one usable set of information.

More Difficult Than I Originally Thought

These requests started to roll in during the off-season, and I even replied to several people saying that I thought this was going to be easy and that I’d have guidance coming out soon on how to do this.

… And here I sit months later having never written on the topic yet.

In theory, averaging a set of three numbers in Excel is easy.  If one system says 25 HR, one says 30 HR, and another says 35 HR, Excel’s AVERAGE formula can easily respond with the average of 30.

But I quickly ran into some big problems that greatly complicated things.

Problem 1 – Lining Projections Up To Do The Averages

In order to aggregate multiple projection systems into one, we need a method of “lining up” the projections from one system with those of another system.  Perhaps Giancarlo Stanton is projected to hit 20 HR the rest of the season by Steamer and 22 HR by PECOTA.

Giancarlo_Stanton_ROS
I made this information up just to illustrate the concept of “lining up” different projections.

We can use formulas in Excel (e.g. VLOOKUP) to pull Stanton’s Steamer projection and place it next to his PECOTA projection.  But you can run into some complications in doing this.  What if one projection system lists him as “Stanton, Giancarlo” and the other as “Giancarlo Stanton”.

Using names to pull data also opens you up to inconsistencies in the name being used.  Is it Jonathan Singleton or Jon Singleton?  AJ Burnett or A.J. Burnett?

If you have taken on the challenge of creating your own rankings, you know that we’ve dealt with this problem before, but on a smaller scale.  In my rankings spreadsheets I use a consistent playerID to pull information between the different tabs.  I prefer to use the Baseball-Reference playerIDs because you can tell who a player is (Stanton is “stantmi03” because there were two other Mike Stanton’s before him).

But seemingly every major baseball site has their own player ID system.  Fangraphs says Stanton is “4949”, Baseball Prospectus uses “57556”, ESPN says “30583”, etc.

This is why I maintain the SFBB player ID map Excel file.  The map allows for this translation or “lining up” to happen.  It’s the bridge that can easily help you take Stanton’s projection from one system and place it next to his projection from another.  Giancarlo_Stanton_PlayerID

Problem 2 – Players Not Projected In All Systems

Continue reading “The Difficulty In Aggregating Projections”

Should You Combine Multiple Projection Systems Into One?

Should I use this projection system or that one?  Why mess around with the second best system if you can easily determine the best, right?

If you search the web, you can locate previous studies that review the accuracy of baseball’s many projection models.

I Don’t Have Time To Read All That.  Just Tell Me what They Say.

Understood.  Here’s my summary:

  • There area lot of different approaches to projecting stats (Marcel, Steamer, Zips, Oliver,PECOTA, etc.)
    • Basic three year weighted average with regression to league average
    • More than three year weighted averages incorporating more advanced component metrics
    • Crowd sourcing
    • Aging curves
    • Similar player modelling
  • No single projection system is consistently better than the others in all the stat categories we care about for fantasy baseball
  • The most accurate projection model changes from year-to-year
  • But there are some that consistently perform well
  • Some systems do well in projecting offensive statistics
  • Some are better at pitching

What Is Also True

A lot of research has been done on the effectiveness of combining or “aggregating” different projections or forecasts into one.  This research was not done with only fantasy baseball in mind, but we can take advantage of it.  Here’s one very interesting article on the topic (it’s from a website named “forecastingprinciples.com” and is a PDF of a study from the Wharton School of Business at Penn, it has to be legit, right?).

The thinking behind aggregating projections is that the wisdom of many intelligent people looking over a lot of information can lead to better results than just one isolated model for projecting future results.  When you combine all of this together you’ll naturally be removing the outliers from the individual models, but hopefully you’re also improving the accuracy as a whole.

The Actual Results

It may not be appropriate to boil a 15 page research paper into a couple of sentences.  But I’m going to do it anyway!  Here’s what the PDF linked above concludes on the evidence on the value of combining forecasts: Continue reading “Should You Combine Multiple Projection Systems Into One?”

How Much Do Current Season Stats Matter?

Every major fantasy league hosting site (Yahoo, CBS, ESPN) allows you to look at recent history (e.g. the last 7 days or the last 14 days).  It’s also very easy to see the year-to-date stats any player has accumulated to this point in the season.

Yahoo_Stats
The Yahoo! free agent list allows you to look at the last 7, 14, and 30 days.

And now that we’re nearly half way through the current season, how much do those current year stats mean?  If you’re trying to add a free agent, should you be looking at the last 7 days?  Is the last month OK to use?  How much can we expect production from the first half of the season to continue into the second half?

CBS_Stats
CBS allows you to look at 7, 14, 21, and 28 days, as well as 3 year averages.

Let’s Take A Quiz

Before we get to the answers to those question, let’s put you to the test with some very specific questions.  I’ll lay out a series of “story problem” (remember middle school math?) questions for you .  Place yourself in each situation and make what you think is the best fantasy baseball decision.

Question #1

Your team recently suffered an injury and you must go out to the free agent list and find a replacement.  Which of these measures is the best method of identifying the player who will perform the best for the rest of the season?

  1. Looking at the statistics for free agents in the last 7 days
  2. Looking at the statistics for free agents in the last 14 days
  3. Looking at the statistics for free agents in the last 28 days
  4. Looking at the statistics the free agents have accumulated to this point in the season (season-to-date stats)
  5. Looking at the projected statistics for free agents for the remainder of the season  (like Steamer or Zips rest-of season projections)

Question #2

Which model(s) above do you actually use to make decisions?

Question #3

Which player would you rather have the remainder of the season given these levels of production so far?

Current production (as of 6/22/2014):

Player PA R HR RBI AVG
Nelson Cruz 306 45 23 60 .299
Chris Davis 252 32 12 37 .220

Question #4

Which player would you rather have the remainder of the season given these levels of production and the Steamer RoS projections below?

Current production (as of 6/22/2014):

Player PA R HR RBI AVG
Nelson Cruz 306 45 23 60 .299
Chris Davis 252 32 12 37 .220

Steamer RoS Projections (as of 6/22/14):

Player PA R HR RBI AVG
Nelson Cruz 320 41 17 47 .261
Chris Davis 341 46 20 52 .261

Question #5

Similar scenario to question four above…  But now imagine that we’re five full months into the season instead of at roughly the half way point.  Who would you rather have in the final month of the season?

  • The player who was incredibly hot for the first five months but that projections say will cool off towards his career averages or
  • The player that has struggled for the first five months but is projected to improve and perform closer to his higher level of career averages over the final month of the season?

Question #6

Which player would you rather have the remainder of the season given these levels of production and the Steamer RoS projections below?

Player IP K/9 ERA WHIP
Andrew Cashner 76.1 6.96 2.36 1.19
Homer Bailey 90.0 8.07 4.68 1.45

Steamer RoS Projections (as of 6/22/14):

Player IP K/9 ERA WHIP
Andrew Cashner 103.0 7.29 3.85 1.27
Homer Bailey 95.0 7.99 3.80 1.22

The Research

The information that follows Continue reading “How Much Do Current Season Stats Matter?”

Projecting X Bundle Update – 2014 Expected Runs Per Game Information

For those that have purchased the SFBB Projecting X Bundle (click here to read about the Bundle or here if you’re interested in purchasing), I have compiled expected runs per game metrics from around the web and put them into a format that you can drop into your Projecting X spreadsheet.

In Projecting X, Mike Podhorzer refers to Baseball Prospectus, Clay Davenport, and Replacement Level Yankees as the resources he uses for his expected RPG metric (this is an input into estimating pitcher wins).  I was able to locate the BP and Davenport information, but from what I can tell, Replacement Level Yankees has not published the projection.  If you can locate it, please feel free to link to it in the comments below this post.

Fangraphs also provides projected standings, and so I included them as the third input.

You can download this file below through the buttons at the bottom of the web part, or possibly even copy and paste from here into your own spreadsheet.

You’ll notice that I removed the 2013 information that was the best guess for 2014 runs per game at the time the bundle was created and released.

Thanks For Reading

Stay smart.