Welcome to the first part of a series in which we’ll go step-by-step through the process of using Microsoft Excel to calculate your own rankings for a fantasy baseball points league (as opposed to rotisserie or head-to-head rotisserie).
Whether you’re in a standard points league at a major site like ESPN or a more advanced Ottoneu league at Fangraphs, this process will help you develop customized rankings for your league. These instructions can be used for a season-long points league or a weekly head-to-head points league.
If you’re looking for info on how to rank players for a roto league, look here.
I recommend going through all the parts of the series in order. If you missed an earlier part of this series, you can find it here:
Please note that this series has been adapted into a nine-part book that also shows you how to convert points over replacement into dollar values and how to calculate in-draft inflation. Click here if you’re interested in reading more about the conversion to dollar values.
ABOUT THESE INSTRUCTIONS
- The projections used in this series are the Steamer 2015 preseason projections from Fangraphs. If you see projections that you disagree with or that appear unusual, it’s likely because I began writing this series in December 2014, still early in the off-season.
- For optimal results, you will want to be on Excel 2007 or higher. Some of the features used were not in existence in older versions.
- I use Excel 2013 for the screenshots included in the instructions. There may be some subtle differences between Excel 2007, 2010, and 2013.
- I can’t guarantee that all of formulas used in this series will work in Excel for Mac computers. I apologize for this. I don’t understand why Excel operates differently and has different features on different platforms.
IN PART 6
In this part of the series we will discuss the concept of replacement level, prove that it can lead to better decision making, demonstrate how it is an objective measure for making positional scarcity adjustments, and then incorporate replacement level adjustments for each position into our projected point values.
Accounting For Replacement Level
Heading in to the 2015 season, Ryan Braun is projected by Steamer to produce 82 R, 25 HR, 82 RBI, and 13 SB (or 752 points in my example league). Buster Posey is projected for 69 R, 19 HR, 75 RBI, and 1 SB (681 points).
Braun’s raw production is clearly superior to that of Posey. But is that all we need to look at to conclude which player is more valuable? Don’t we need to include some measure of “replacement level” in this calculation? Isn’t that what WAR is all about? Wins Above Replacement?
How do I account for the fact that the day after our fantasy draft I can go out to the free agent listing and pick up an OF that would produce 61 R, 10 HR, 47 RBI, and 15 SB (478 points), or a Catcher that would produce 38 R, 9 HR, 45 RBI, and 7 SB (319 points)?
Clearly the replacement catcher is much less productive than the replacement level OF.
Using Points League Settings
You’ve been following me through the creation of a rankings file for an example league. We just finished converting projected statistics into point values for this league, so let’s take a look at comparing Braun to Alejandro De Aza (a hypothetical replacement level OF) and Posey to Christian Bethancourt (a hypothetical replacement level catcher).
| Player | Projected Points |
|---|---|
| Ryan Braun | 752 |
| Alejandro De Aza | 478 |
| Buster Posey | 681 |
| Christian Bethancourt | 319 |
Braun is projected for 274 points over the replacement level outfielder and Posey is projected for 362 points more than the replacement level catcher!
That means Posey is roughly 88 points more valuable than Braun, despite having lower overall projected points.
If you’re having a hard time digesting that, think of it this way. Let’s assume Braun and Posey represent second round draft picks (just go with it, don’t argue) and De Aza and Bethancourt will be last round draft picks (replacement level).
The team that takes Braun in the second round and Bethancourt in the last round would be projected for 1,071 points. The team that takes Posey in the second round and De Aza in the last round would be projected for 1,159 points. Again, that’s 88 more points than the Braun/Bethancourt combination!
This is why considering replacement level matters.
Positional Scarcity Adjustments
You have probably come across suggestions or you might have even thought to yourself that you should “bump” a player up your rankings because he plays a weak position. But is this really appropriate? How much do you bump him up?
Another great benefit of incorporating replacement level into your rankings is that it makes your positional scarcity adjustments for you!
You just saw how we proved Posey’s 681 points as a catcher are more valuable than Braun’s 752 from the outfield. Rather than arbitrarily “bumping” Posey in the rankings, we can figure out exactly where he should be ranked by calculating his “Points Above Replacement”.
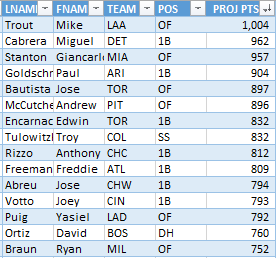
Let’s look at the top 15 projected hitters in my example points league.
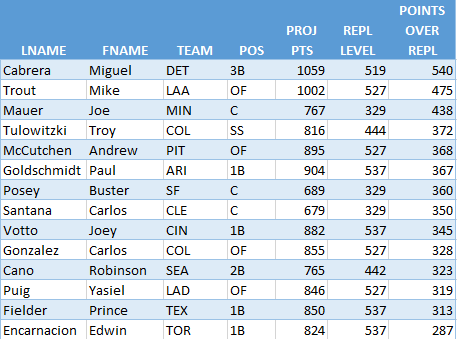
Not a catcher to be found. But if we presume this league has 24 starting catchers (you need to read this if you play in a two-catcher league), things change significantly when we calculate points above replacement.
Three catchers rocket into the top 10 while OF and 1B are devalued some. This movement that takes place after you calculate Points Over Replacement Level IS THE POSITIONAL SCARCITY ADJUSTMENT. Players move exactly the proper amount. No guesswork.
EXCEL FUNCTIONS AND FORMULAS IN THIS POST
Nothing really new here. We’ll just be using things we’ve already used in earlier parts of the series. We will use another VLOOKUP formula, create a table, and use structured references to build some formulas.

