New Excel Tool – Automated SGP Rankings and Dollar Values

I’m a firm believer that using customized projections and running those through a valuation system, like standings gain points, is the single biggest leap a fantasy owner can take in improving at fantasy baseball. The problem with taking that step is it’s a significant hurdle to get over.

It’s complicated. It takes learning advanced Excel skills. It’s time consuming. It’s not for everyone.

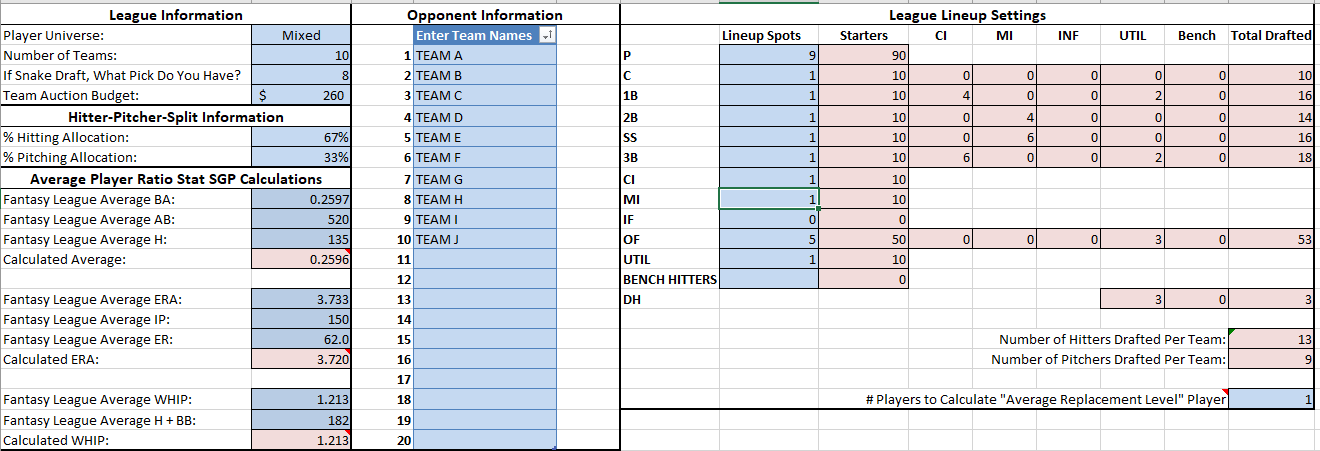
I’ve been hard at work to help solve these problems. It’s taken several years, but I’m finally able to announce the new Automated SGP Rankings Excel Tool. With this Excel tool, you’ll be able to calculate rankings and dollar values from your favorite projection set within minutes. You can use Steamer, any other Fangraphs projection set, Rotowire, Mastersball, and even PECOTA. Whatever projection set you have access to should work.

You can have tailored rankings and dollar values within minutes using the Automated SGP Rankings Tool.

Interested in learning more about this tool? Watch the following video or click here to read all about its features.

The Automated SGP Rankings Excel Tool is now available for the 2019 season! This tool will save you huge amounts of time. You won’t be stuck troubleshooting Excel formulas. You can focus on player research and forming your own opinions about players. You’ll have custom dollar values to make decisions from. Those values will be tailored to your league’s specific settings. It’s a great step toward winning your league this upcoming season.

The Excel tool currently works with the following rotisserie categories:

Hitting Categories Pitching Categories
Runs (R) Wins (W)
Home Runs (HR) Saves (SV)
Runs Batted In (RBI) Strikeouts (K)
Stolen Bases (SB) Earned Run Average (ERA)
Batting Average (BA) Walks + Hits per Inning Pitched (WHIP)
On Base Percentage (OBP) Quality Starts (QS)
Slugging Percentage (SLG) Holds (HD)
On Base Plus Slugging (OPS) Saves + Holds (SV+HD)

Click here to read more about its features and to purchase the tool.

Analyzing AL- and NL-Only Standings Data

As much as I love the standings gain point approach to valuing players, it does have an a couple of inherent weaknesses.

First, it’s dependent upon some form of league history to work. The whole ranking and valuation process is derived from previous standings data! Those starting new leagues, or joining an existing league, don’t have this information available.

Second, assuming you have prior standings to draw from, I’ve always been bothered by the small sample sizes of that data. And I don’t know about you, but something odd always seems to happen in my leagues. One year someone runs away with it, one year it’s a tight race between five teams, one year we add two teams, the next year we contract a team.

What are we to do?!?!

Thank You OnRoto and NFBC

Thankfully, some very generous league hosting sites have made their standings information publicly available or shared it with me! With their help, I think we can put to bed the concerns over lack of league history and small sample sizes. We have MANY leagues to look at now.

The fine folks at OnRoto.com have shared their NL- and AL-only standings data. If you’re not familiar with OnRoto, their goal is to cater to sophisticated fantasy leagues, many of which play by the “old-school” rules required by “long-term players”. They also are willing to fulfill just about any customization request (more on this later!).

I’ve also written several times about NFBC standings data for mixed leagues.

What follows is a close look at the 2016 12-team “only league” data from OnRoto. If you’re curious, you can see the 2015 AL information here and the 2015 NL information here.

Now, let’s take a look at the data!

AL-Only Standings by Category

Here are the average AL statistics within each rotisserie scoring category:

RK PTS AVG R HR RBI SB ERA WHIP W K SV
1 12 0.272 987 291 964 128 3.583 1.191 94 1,311 90
2 11 0.268 945 274 926 115 3.753 1.227 88 1,271 79
3 10 0.266 917 262 894 107 3.856 1.245 85 1,229 72
4 9 0.264 889 254 867 100 3.934 1.258 82 1,194 64
5 8 0.262 867 245 846 94 4.014 1.271 80 1,159 57
6 7 0.260 844 236 823 89 4.079 1.286 77 1,133 52
7 6 0.259 824 227 793 83 4.160 1.298 74 1,108 46
8 5 0.257 804 217 773 78 4.225 1.310 72 1,083 40
9 4 0.255 777 207 747 73 4.280 1.322 70 1,048 36
10 3 0.253 743 195 714 67 4.386 1.339 66 1,005 30
11 2 0.250 711 184 681 61 4.525 1.360 61 961 21
12 1 0.246 636 162 604 49 4.728 1.392 55 901 11

To better explain what you’re looking at, a team could have finished in 10th place in the standings but still finished 1st place in the home runs category. That team’s data appears on the “Rank 1” row, not on the “Rank 10” row.

NL-Only Standings by Category

And here are the NL stats:

RK PTS AVG R HR RBI SB ERA WHIP W K SV
1 12 0.276 950 257 915 164 3.411 1.183 93 1,354 88
2 11 0.272 917 244 879 143 3.596 1.217 86 1,284 76
3 10 0.269 883 231 845 133 3.710 1.232 82 1,234 68
4 9 0.267 863 222 816 122 3.810 1.253 79 1,192 61
5 8 0.264 840 214 798 112 3.902 1.270 75 1,155 54
6 7 0.263 813 206 775 106 3.994 1.284 73 1,125 49
7 6 0.261 787 198 743 99 4.080 1.297 70 1,093 44
8 5 0.259 763 191 718 92 4.173 1.313 66 1,062 37
9 4 0.258 740 184 692 85 4.241 1.329 63 1,026 33
10 3 0.255 703 174 660 78 4.351 1.347 60 991 27
11 2 0.252 673 160 630 70 4.445 1.372 55 945 20
12 1 0.249 618 143 570 56 4.631 1.406 48 826 11

Continue reading “Analyzing AL- and NL-Only Standings Data”

Standings Gain Points for NFBC Leagues

In the post that follows, I’ll share standings gain points (SGP) factors for the NFBC Main Event, NFBC Draft Championship, and NFBC Online Championship for each of the last five years (2012-2016). But I’ve got to lay some groundwork before we get there…

Raw vs. Relative

While the discussion is a bit lengthy, I think this article discussing “raw” and “relative” SGP contains one of the most significant realizations I’ve had in fantasy baseball.

The quick and dirty explanation of this realization is that it is not only the raw SGP factors (or denominators) that drive player value calculations. The relationship, or relative value, between the SGP factors is also meaningful. Not only that, but looking exclusively at raw factors can be misleading, as it is difficult to see these relationships.

To illustrate, here are two example sets of raw SGP factors for a league:

League BA R HR RBI SB
2013 15-team NFBC Main Event 0.00161 13.751 5.533 15.115 6.228
2016 15-team NFBC Main Event 0.00150 15.366 6.561 16.838 6.375

I refer to these as raw factors because they’re calculated using the standard process prescribed by SGP. A calculation is made for each scoring category and those numbers are then fed into the process that’s used to rank or assign dollar values to players.

Looking again at the table of raw data above, you might think, “Wow, what happened in the last three years that caused those significant changes in the SGP factors?”

You might even start spewing some narrative about the changing landscape of baseball, the rise in strikeouts, and the power surge MLB experienced last season.

But before you start that process, let’s take a look at those same sets of SGP factors, after they’ve been converted into relative form:

League BA R HR RBI SB
2013 15-team NFBC Main Event 0.00011 0.90976 0.36609 1.00000 0.41202
2016 15-team NFBC Main Event 0.00009 0.91256 0.38963 1.00000 0.37862

The numbers still fluctuate. And if you run the math, from 2013 to 2016 the categories changed about 10%, on average, in both the raw and relative calculations. But seeing the factors in relative form really gives me a lot more confidence in my calculations.

I was always wondering if I screwed up my calculations before making this realization. “Could RBI really have changed that much?”

To be clear, I did not develop this way of looking at the numbers. I made the realization after reading “Winning Fantasy Baseball” by Larry Schechter. Although I didn’t invent this approach, I continue to share it because I think a lot of folks are confused by the raw numbers and this confusion leads to decreased confidence in the SGP approach.

How to Calculate Relative SGP

Continue reading “Standings Gain Points for NFBC Leagues”