Everything You Need to Know About the Player ID Map

Contents

This post is intended to be an all-encompassing discussion of the Player ID Map tool. Click the links below to jump directly to a specific section below. Use the Back browser or mouse button to jump back to this list.

What Is the Player ID Map?

The MLB and fantasy baseball landscapes are wide reaching. We fantasy players gather information, projections, and opinions from many locations. Any time you have a situation like this, where data is coming from many disparate places, some form of “mapping” table can help connect the dots and data points from these different sources.

If you’ve ever tried to line projections from Fangraphs up with projections from Baseball Prospectus, Mastersball, or Baseball HQ, you’ll understand this challenge. You may have tried a VLOOKUP in Excel or Google Sheets to line the data up side-by-side. But player names are not a great mechanism to do this. Names can change (see Nick Castellanos and Nicholas Castellanos or B.J. Upton and Melvin Upton). Name conventions can differ between sites (see A.J. Pollock and AJ Pollock or Ronald Acuna and Ronald Acuna Jr.). Even worse, there are occasionally duplicate names (Chris Young being a recent example).

The Player ID Map solves these discrepancies. It enables an owner to line up an A.J. Pollock in their spreadsheet to an AJ Pollock from projection system. The Player ID Map is the bridge that has enabled me to build tools like the Projection Aggregator and the Automated SGP Ranking Tool. It enables building spreadsheet tools and other solutions that can work with or link to major sports websites (ESPN), projection systems (Steamer, Razzball, Mastersball, ATC), and fantasy baseball providers (NFBC, Fantrax, Yahoo!, Draftkings).

What Versions of This Tool are Available?

All the different “versions” below are pointing to the same source information. They are just different formats of using or viewing the data.

  1. Excel Version (LINK) – A downloadable Excel file that can be incorporated into your own fantasy baseball spreadsheets. The data in this file contains connections to the main version I maintain in an online Google Sheet. This version will likely be out of date when it is downloaded, but instructions on how to refresh the data through the connection to the Google sheet are easy-to-follow and are included later in this post. The Excel version contains two tabs:
    • PLAYERIDMAP – All available IDs and naming system information that I track
    • Change Log – Explanations of changes made, including additions, corrections, and dates these changes were made
  2. Web Version of PLAYERIDMAP (LINK) – A live look at the html/web-based version of the PLAYERIDMAP tab in the live Google Sheet. You might use this if you just want to see the Player ID Map or look for specific pieces of information
  3. CSV Version of PLAYERIDMAP (LINK) – A one-time CSV download of the Player ID Map tab of the live Google Sheet. I wouldn’t really recommend using this because there is no connection back to the live data I maintain, like in the Excel version. But it could be used if you only need an easy-to-use one-time dump of the data.
  4. Web Version of Change Log (LINK) – A live look at the html/web-based version of the Change Log tab in the live Google Sheet. This could be used to review recent changes to the central Sheet and determine if a refresh is needed.
  5. CSV Version of the Change Log (LINK) – I have no idea why I make this available. Seems like it wouldn’t be valuable at all! But it’s here if you need it. It’s a one-time CSV download of just the Change Log tab.

How Do I Update or Refresh the Player ID Map?

Note, you will be prompted about the potential danger of downloading Excel files from the internet the first time you download and open the Player ID Map. There are no dangerous macros or harmful code embedded in the file. It does maintain a connection back to my Google source file to enable you to download updated information. Click “Enable Editing” to accept this reminder and be able to interact with the Excel file.

You may at times also see an Excel warning that external data connections can be harmful. These are common warning messages and good reminders that you do have to be careful what you download on the web. Click “Enable Content” to allow the data connection to pull in refreshed player ID data.
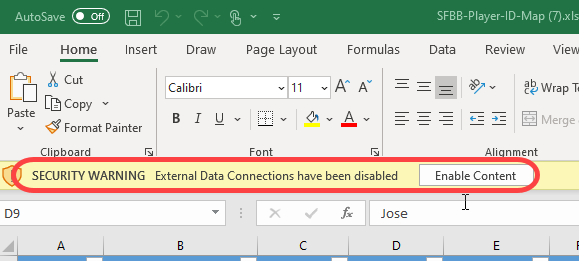
If you trust me and do download the Excel file, here’s how to refresh it.

Step Description
1. Select a cell inside of the player ID data. It does not matter which player or piece of data. It just has to be something inside the blue and white table.
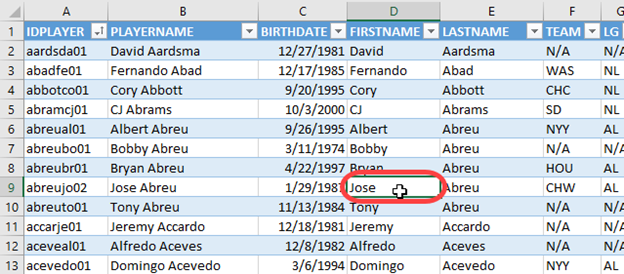
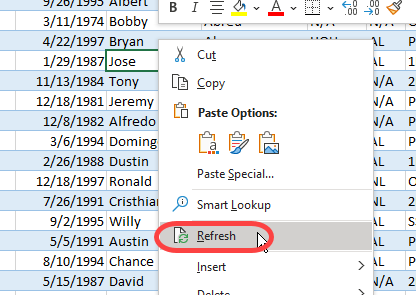
2. Right-click on the selected cell and choose the menu option to “Refresh”.
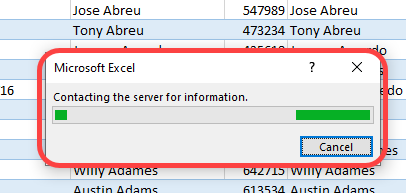
3. You will begin to see various status messages as Excel begins to refresh the connection. You may see information being relayed in the bottom right of Excel.

A popup may appear. And status information may even appear in the bottom left of Excel (I couldn’t grab a screenshot quick enough).

The entire refresh may take 60 seconds or so. And it may depend on how much time has transpired since your last update. You don’t really get a “This is Done!!!” message. You’ll just know you’re ready to proceed when all the statuses stop changing.

Origin

I created the Player ID Map in 2013. I started my ID map largely from information from Tim Blaker’s map. Tim continues to provide updates in his mapping file, but our maps have different purposes. I needed the flexibility to add new names and systems and not be reliant upon someone else. But I continue to use Tim’s map as an input to mine when I’m performing major updates for new players that enter the baseball world.

The Player ID Map has grown since 2013. I continue to add new systems, new name formats, and even new information about each player that will help me provide spreadsheet tools the the SFBB audience.

Do People Really Use This Thing?

I’m surprised at how often it’s used. At the time I write this article, the file has been downloaded or refreshed over 280,000 times (Who knows. 200,000+ of them could be me tinkering in spreadsheets). If I could only figure out a way to charge ten cents each time it’s used…

It’s an integral part to building long-lasting and flexible fantasy baseball spreadsheets that can take advantage of many different sources of baseball data.

Does the Player ID Map Include All MLB Players?

No. The tool is intended to be used for fantasy baseball purposes. Accordingly, the goal is to include only “fantasy relevant” players. That’s a purposely vague threshold. In the preseason, I generally keep the top 750ish players accordingly to NFBC ADP included in the Player ID Map. This should be enough players to cover most normal leagues. It’s possible the Player ID Map will not be deep enough for your 20-team NL-only league, your AL Central-only league, or your middle-reliever contest. Keep reading for advice on how to get more players added to the Player ID Map.

Continue reading “Everything You Need to Know About the Player ID Map”
How to Analyze SGP Denominators from Different Sources

Do you know if the SGP calculations you’ve done for your league are accurate?

Are you concerned that your home run SGP denominator is 8.87 and Larry Schechter’s book Winning Fantasy Baseball suggests using 5.93 for a 12-team league? Or that your RBI calculation shows 22.31 and the 12-team NFBC history I just calculated shows 19.55?

What does this all mean? Will your rankings be accurate? How can they be when your denominators seem significantly different than those you see elsewhere?

Calm Down, These Numbers Are More Consistent Than You Realize

I know. You’re wondering how on Earth I can say that. How can a HR denominator of 8.87 be consistent with one of 5.93?

To be honest, I’ve had those same fears about SGP. I feel so scientific and strategic by calculating SGP. And then I look at my denominators in comparison to what I see published elsewhere and that confidence evaporates and is replaced with doubt.

In this post I’m going to share an important realization I just had about SGP (yep, I’m still learning too), show you how to properly compare your SGP denominators to different resources, and demonstrate that the dollar values calculated by different sets of denominators are more similar than you would believe. When we’re done here, I think we’ll all feel a lot more comfortable about things.

Story Time

This story starts with me calculating the SGP for the last three seasons of NFBC leagues (which make their standings information publicly available).

I read Winning Fantasy Baseball a couple years ago (if you haven’t read it and you’re about to read 2,500 words on SGP denominators, you really should get the book), and I vaguely remembered the book giving SGP denominators for a variety of league types. I wanted to verify that my findings were similar to Schechter’s.

Here’s what I found:

Source BA R HR RBI SB
2015 12-team NFBC Online Championship 0.00180 19.92 8.43 19.55 7.59
Winning Fantasy Baseball 12-team League 0.00165 15.52 5.93 16.30 5.93

Damn. WTF does this mean? Those don’t look close to me. Did I do something wrong?

A Very Important Point

As I looked more closely at the book, I noticed I missed a very important point the first time I read it. Next to each number, Schechter had calculated a “relative SGP value”.

SGP Type BA R HR RBI SB
Raw SGP Denominator 0.00165 15.52 5.93 16.30 5.93
Relative SGP Denominator n/a 1.05 2.75 1.00 2.75

And here’s the important point Schechter makes about these calculations:

… when you’re trying to adjust SGPs for leagues of various sizes, it’s important to realize that the raw value of the SGP isn’t very important, but rather the ratio of the values.

~ Larry Schechter, Winning Fantasy Baseball

Mine Is Bigger Than Yours Is

I glossed over that red bolded sentence on previous reads (because it’s not bolded red in the book…). But this small statement buried in the middle of the 350-page book is exactly the point I needed for the self-doubt I was experiencing.

So in order to hopefully save you the same trouble, take note! You can’t compare your SGP denominators to someone else’s. You have to convert them to a relative scale first.

Raw Versus Relative – An Example

Let’s focus in on just the HR and RBI stats from the table above.

SGP Type HR RBI
Raw SGP Denominator 5.93 16.30
Relative SGP Denominator 2.75 1.00

If it takes 16.30 RBI and 5.93 homers to move up the standings, this essentially means that one home run is 2.75 times more important than one RBI (home runs are more scarce, so getting one of those is more valuable than the more common commodity, RBI).

16.30 / 5.93 = 2.75

Do you remember working with fractions in elementary school? I liken this practice to that whole “lowest common denominator” charade we had to go through. Dropping the SGPs to a relative scale is like converting them to a lowest common denominator. If you leave the SGP factors grossed up at these high numbers (like 5.93 and 16.30), it’s more difficult to see the relationships you can see when they’ve been translated into the relative scale.

One More Math Concept

If you read Using Standings Gain Points to Rank and Value Fantasy Baseball Players or if you’re generally familiar with the SGP approach, you know that we would divide a player’s home run total by the home run “SGP denominator” to know how many SGP the player contributes due to his homers.

For example, if a player is projected by 30 home runs, an SGP denominator of 5.93 would indicate the player’s homers are worth 5.1 points in the standings (30/5.93=5.1). If the same player is projected for 83 RBI, an SGP denominator of 16.30 suggests the RBI are also worth 5.1 SGP (83/16.30=5.1). The 30 HR are worth the same as 83 RBI (5.1 SGP).

However, the way Larry Schechter has calculated his relative SGP would require you to multiply a player’s stats to achieve that same equality. For example, the 30 HR multiplied by 2.75 is 83 “points”. The 83 RBI multiplied by 1.00 is also 83 “points”. The 30 HR are worth the same as 83 RBI (83 relative SGP).

For Consistency, I Will Calculate Relative SGP Another Way

If you look back at the big bolded numbers above, Larry Schechter used the largest statistic (RBI for hitters and K for pitchers) as the numerator in his conversion. I will use it as the denominator.

5.93 / 16.30 = 0.364

I’m mostly doing this because everything I’ve written about SGP to this point tells you to DIVIDE BY THE SGP DENOMINATOR (heck, it’s called a denominator, meaning it’s on the bottom of the fraction). To now tell people to MULTIPLY BY THE RELATIVE SGP DENOMINATOR seems too confusing to me.

I’m sure I’ve confused the hell out of everyone at this point either way. And I apologize for this. But I think this topic is very important to understand. I’m giving it my best! Even if you’re confused, keep reading. I think this will all pull together very nicely in the end.

Going back to our example of a player with 30 HR and 83 RBI, if I divide by an SGP denominator of 0.364 I get that same 83 “points” (forgive the rounding), meaning the 30 HR are worth the same as the 83 RBI under this approach. So whether you use Schechter’s relative numerator and multiply or my relative denominator and divide, you get the same results.

How to Calculate “Relative” SGP Denominators

I’ve talked a lot about multiplying and dividing. So just to be clear, to put your SGP denominators on the same relative scale, choose the category with the largest numeric value, then divide each stat categories raw SGP denominator by that largest raw SGP denominator.

The largest numeric denominator is typically RBI for the hitting categories (the 16.30 from above is the largest SGP denominator) and strikeouts for pitching.

For the rest of this post I will be using this calculation of relative SGP denominators and NOT the way suggested in Winning Fantasy Baseball.

My NFBC Relative Versus Winning Fantasy Baseball’s 12-team Relative

Using the method described above, I calculated the relative denominators for Larry Schechter’s 12-team suggestions and my 2015 NFBC findings. Here are the results:

WINNING_FANTASY_BASEBALL

First look at the white lines. These give me that queasy feeling I was describing earlier. He’s saying 5.93 HR for a 12-team league? And I came up with 8.43? That’s 2.5 HR difference. How can these suggestions even be in the same ballpark?

Now look at the yellow-shaded lines. After everything is put on the same scale things look a lot more reasonable. When you look at all items on a relative scale, you can see many of the categories are strikingly similar (BA, R, RBI, SB, K, SV), but still show small variations. There is some variance in the other categories, but things don’t look as stark as with the raw denominators. This supports our beliefs about SGP being able to “tailor” to our league tendencies and preferences, but still leaves me feeling a lot more comfortable that my denominators are in fact closer to Larry Schechter’s than it appears on the surface.

Right around this time I’m starting to feel more comfortable with my analysis. But I’m also very curious about what happens if I start looking at SGP denominators from other sources. So I set out to find as many sources as I could find.

NOTE: After publishing this article, it came to my attention that there’s a typo in Winning Fantasy Baseball that makes this last segment somewhat less relevant. I’ve elected to keep it in despite this.

Other SGP Denominator Sources

The reliable sources I was able to locate for this analysis are:

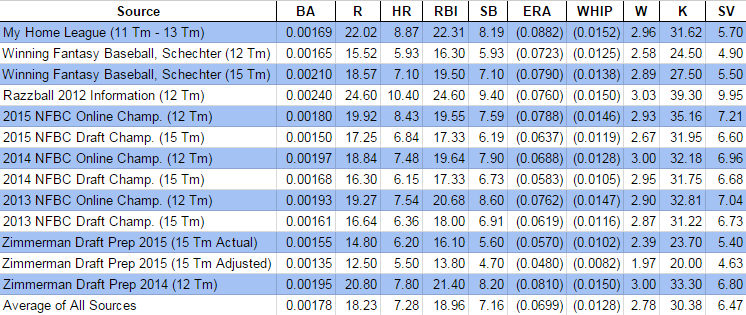
Not bad. I was able to scrape up 13 different resources for comparison. And I threw in the average of those 13 resources as my 14th.

Here’s the Raw SGP Data

You can see things are all over the map. You can see general patterns, but the data fluctuates wildly. Some of the raw SGP denominators are almost double others. For example, Larry Schechter’s 12-team HR denominator is 5.93 while Razzball’s 2012 article calculated a 10.40!

And Here’s the Relative SGP Data

Continue reading “How to Analyze SGP Denominators from Different Sources”

How To Get Started With Daily Fantasy Baseball – Part 2 – “The Book” and Addressing the Myths

Welcome to the second segment in my series documenting my own journey of getting started with daily fantasy baseball. In the first segment I did some introductory background reading, started to identify some analysts I can trust, took notes about research topics to focus on, and started planning features to be included in an Excel spreadsheet.

In this next segment we will take a closer look at some of the biggest myths that I’m seeing perpetuated out there.

I Can’t Believe We Even Have to Talk About This

I didn’t think I’d have to say anything like that until my daughters were teenagers… But here we are.

Just because you read something on the internet doesn’t make it true. We’ve all heard that before, right? I got up on my soapbox at the end of Part 1 and warned you to be careful out there… And here’s an example of why:

I would argue that BvPs are the most reliable out of all the sets we commonly use because they have the most amount of similar variables.

While it is wrong to accept BvPs as fact, it is equally wrong to discount their merit entirely.

BvPs are just one of the many things you should consider when building a roster but they are not the only thing.

Those are all from the same article talking about the merits of BvPs, or “Batter versus Pitcher” statistics. I promise you the article exists but I am not going to link to it. I’m not here to start fights. I merely want to point out that this misinformation exists, both in the form of online advice and it must also be a viable strategy in some DFS players’ minds.

Why Are You So Confident That BvPs Don’t Matter?

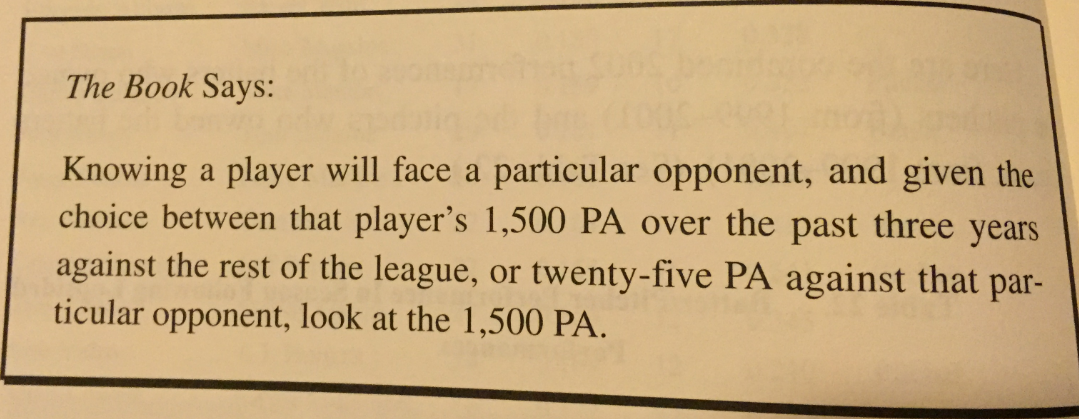
I can definitively say they don’t because it’s been studied by people much smarter than me. Studies using years and years of MLB data have been completed on this topic multiple times and have found that batter-vs-pitcher (or “BvPs”) information is not predictive unless you are talking at least a history of over 100 ABs between the two players.

So we have credible studies based on oodles of data performed by very smart people. Or we have baseless claims, anecdotes of individual examples, and Paul Goldschmidt’s numbers against Tim Lincecum on the other side.

If you find a study that suggest BvPs are meaningful, please let me know. But from what I have seen so far, it appears to be very irresponsible to suggest BvPs have value.

What Research Are You Referring To?

The main and most well known study I’m referring to is from “The Book” by Tom Tango, Mitchel Lichtman, and Andrew Dolphin. They studied “batters owning pitchers” and flipped it and studied “pitchers owning batters” from the time frame of 1999-2001. They identified players that “owned” other players during that three year span. Then they looked at what happened for those same players in 2002. In a very nice coincidence, in 2002 the hitters had 361 plate appearances against the pitchers they “owned”. And in that same season the pitchers had 361 plate appearances against hitters they “owned”.

The results were that the hitters had a wOBA of .349 against the pitchers they owned. These 30 hitters that were studied had wOBAs against those same pitchers ranging from .500 – .800 the two prior seasons. Then in 2002 they hit a combined .349, which is essentially league average.

And the pitchers that had dominated a group of batters allowed a wOBA of .343. Those 30 pitchers had wOBAs allowed ranging from below .100 to .210 from 1999 – 2001. Then in 2002 they too only allowed a league average wOBA against.

The results in The Book are clear: Continue reading “How To Get Started With Daily Fantasy Baseball – Part 2 – “The Book” and Addressing the Myths”

How To Pull a Player ID From a Hyperlink in Excel

Maybe you’re trying to build a the next great daily fantasy baseball spreadsheet.  Or maybe you’re attempting to figure out who to start next week.

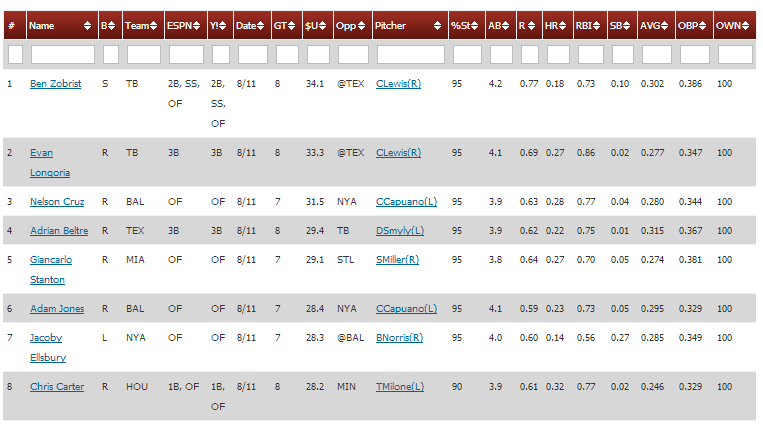
You’ve got plans to use a powerful projection tool like Razzball’s Hitter-Tron…  but then you see it.  There’s not a player ID to be found!  How can you take data from a site like Razzball and drop it into your existing rankings, dollar value, or trade evaluator spreadsheets?

Giancarlo_Stanton_Ben_Zobrist_Daily_Projection

You Know Me.  I’m Obsessed With PLayer IDs.

They’re the best way to build a reusable spreadsheet that you can just drop projection data in to.  You can have all sorts of valuation formulas, trade evaluators, or daily roster lineup tools ready to go.  You just drop in some projections with player IDs and everything seamlessly links up and calculates.

Look Closely At the Links

Even if you don’t see a player ID at first glance, on many sites you can still get what you need if you look carefully.

Hover over a player’s hyperlink.  Depending on your browser you should somewhere see the web address for the hyperlink (in Google Chrome the destination of the link shows in the bottom left on the status bar).

Evan_Longoria_Razzball

There’s a player ID in there!  9368 for Evan Longoria.  A quick look at the PlayerID Map tells us the 9368 happens to be Evan Longoria’s Fangraphs ID.

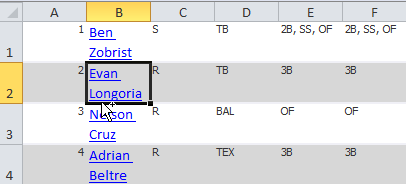
Unfortunately, if you paste the Hitter-Tron information into Excel, you don’t get text about the web address.  You’re left with just the hyperlink itself and no reference to player ID #9368.

Zobrist_Longoria_Cruz_BeltreThere’s not even an existing Excel formula we can use to just pull out the web address.  We have to get a little advanced and create our own.

Step-By-Step Instructions

Continue reading “How To Pull a Player ID From a Hyperlink in Excel”