Recent Podcast Appearances – HQ Radio and PullHitter Podcast

I had the opportunity to make a guest appearance on two of my favorite podcasts in the last several months. Read below for details and links to listen.

Baseball HQ Radio with Patrick Davitt (September 16, 2022)

I discuss this a little during the interview with Patrick, but when I first started this website and was trying to immerse myself in different opinions and tactics for playing rotisserie, Baseball HQ Radio was a huge help in learning and improving. I went so far as to listen to all the old interviews as far back as my podcast player would go. I believe the format of the podcast has change slightly over the years, but the guest interviews with teachers and unique thinkers like Ron Shandler, Gene McCaffrey, Triston Cockroft, Mike Gianella, Todd Zola, and many others were helpful at forming my approach.

Even though the podcast took place while the 2022 season was still ongoing, as with much of my content, I try to keep things pretty evergreen and always relevant. We discuss a lot of strategy and fantasy baseball philosophy, along with some break down and conclusions from the 2022 season.

It was an honor to make an appearance on this show. HQ Radio is legendary and one of the longest running podcasts around.

The episode runs over three hours, but my segments all fall within the first half of the show.

PullHitter Fantasy Baseball with Rob DiPietro (January 13, 2022)

Welp. If you thought the HQ podcast was eventful, this may have topped it. Rob (2020 NFBC Draft Champions winner) lined up to have me, Jeff Zimmerman, Steve Weimer (2nd and 6th overall in 2022 NFBC Main Event), Phil Dussault (2021 NFBC Main Event, NFBC Auction Championship winner and 2021 Online Championship runner up), and Toby Guevin (multiple time NFBC Main Event and high stakes league winner). I don’t think this much NFBC success has been on one podcast before.

This conversation covered a wide range of topics and interesting discussions, ranging from The Process to how the group is handling the MLB rule changes, as well as some very interesting strategy and process discussions about topics like aggregating projections and how managers should best spend their time

I will note that I really enjoy listening to Rob’s podcast and how he takes the individual interviews with fantasy managers to the next level of depth. Some folks object to very lengthy podcasts, but I think that’s the beauty of the medium. There’s no way to uncover a lot of the details that Rob is able to by forcing an interview to fit within a tight window. The conversation here does ramble at time, but then there are some truly valuable nuggets and discussions that wouldn’t have surfaced if we had followed a more structured format.

Below you’ll find the link to the podcast as well as a snippet Rob created from some of my commentary.

2017 Average Standings and SGP for the 2018 Season

In order to prepare for the upcoming season, we need some important information from last year. In this post, I’ll share with you the average standings for 12- and 15-team NFBC leagues, and the average ERA, WHIP, and batting average in those leagues. With this information, you should have everything you need to get started on your SGP rankings for the 2018 season.

Where Do I Get This Data From?

The last several years, I’ve participated in the NFBC’s Draft Champions competition. By participating in such a league, a user gets access to see the standings to all the various NFBC competitions.

As far as I can tell, it seems like you need to be a registered NFBC user to see the standings data. If you happen to be one (and you’re logged into the NFBC site), you can see standings data for the various contests at these links:

I take this data and manipulate it in Excel to calculate average standings across all the leagues using the process I describe here.

If you are not an NFBC user, you can see some of the historic analysis I’ve compiled from 2012 through 2016 here.

With that in mind, let’s take a look at the 2017 results.

12-team League Average Standings

Across the 149 Online Championship leagues hosted by NFBC, the average standings for first through twelfth are shown below. Note, the 1,156 RBI is the average of all teams that finished in first place in RBI. It is NOT the average of what league winners averaged in the RBI category. The league winner in RBI could have finished in 7th place overall, but is included in the 1,156 average figure.

RK PTS AVG R HR RBI SB ERA WHIP W K SV
1 12 .2788 1,178 365 1,156 174 3.480 1.171 107 1,522 105
2 11 .2750 1,144 349 1,121 159 3.638 1.204 102 1,469 97
3 10 .2727 1,125 340 1,098 149 3.740 1.222 98 1,435 90
4 9 .2706 1,108 332 1,080 142 3.827 1.238 96 1,403 85
5 8 .2688 1,091 324 1,061 135 3.891 1.250 93 1,372 81
6 7 .2674 1,078 317 1,045 129 3.960 1.263 90 1,341 76
7 6 .2660 1,064 310 1,027 123 4.027 1.276 88 1,313 70
8 5 .2643 1,048 303 1,011 117 4.100 1.287 85 1,282 65
9 4 .2626 1,029 296 992 111 4.171 1.300 82 1,245 59
10 3 .2609 1,010 288 972 105 4.263 1.316 78 1,209 51
11 2 .2588 983 277 948 96 4.375 1.336 73 1,150 40
12 1 .2543 937 258 896 80 4.557 1.366 66 1,057 26

12-team League SGP Factors

Using the information from the league average standings, the raw and relative SGP factors are as follows:

SGP TYPE AVG R HR RBI SB ERA WHIP W K SV
Raw 0.0019 19.060 8.526 20.635 7.405 (0.086) (0.0160) 3.288 37.244 6.461
Relative 0.00009 0.924 0.413 1.000 0.359 (0.0023) (0.0004) 0.0883 1.000 0.174

Historic Online Championship (12-team League) SGP Factors

Here are the Online Championship hitting categories:

Year Type BA R HR RBI SB
2012 Raw 0.00220 19.197 8.016 20.675 8.270
2013 Raw 0.00193 19.265 7.537 20.685 8.603
2014 Raw 0.00197 18.843 7.481 19.639 7.900
2015 Raw 0.00177 19.920 8.429 19.549 7.591
2016 Raw 0.00182 19.721 8.797 21.527 8.508
2017 Raw 0.00193 19.060 8.526 20.635 7.405
2012 Relative 0.00011 0.92848 0.38769 1.000 0.40001
2013 Relative 0.00009 0.93136 0.36435 1.000 0.41589
2014 Relative 0.00010 0.95950 0.38094 1.000 0.40224
2015 Relative 0.00009 1.01898 0.43115 1.000 0.38828
2016 Relative 0.00008 0.91607 0.40863 1.000 0.39520
2017 Relative 0.00009 0.92366 0.41320 1.000 0.35885

Here are the Online Championship pitching categories:

Year Type ERA WHIP W K SV
2012 Raw (0.07840) (0.01320) 3.253 30.968 7.184
2013 Raw (0.07623) (0.01472) 2.899 32.811 7.038
2014 Raw (0.06880) (0.01280) 2.999 31.181 6.964
2015 Raw (0.07876) (0.01464) 2.926 35.163 7.210
2016 Raw (0.08042) (0.01529) 3.184 34.212 6.842
2017 Raw (0.08587) (0.01548) 3.288 37.244 6.461
2012 Relative (0.00253) (0.00043) 0.10503 1.000 0.23197
2013 Relative (0.00232) (0.00045) 0.08837 1.000 0.21452
2014 Relative (0.00214) (0.00040) 0.09320 1.000 0.21640
2015 Relative (0.00224) (0.00042) 0.08321 1.000 0.20505
2016 Relative (0.00235) (0.00045) 0.09307 1.000 0.19998
2017 Relative (0.00231) (0.00042) 0.08827 1.000 0.17348

15-team League Average Standings

The NFBC offers two different types of 15-team leagues. The “Main Event” is a closer approximation to your typical home league, in that it allows for in season player pickups from the waiver wire. The Draft Championship does NOT allow in-season moves, but you do draft a 50-player team in order to build a deeper roster that might get you through the season without the ability to add anyone.

Continue reading “2017 Average Standings and SGP for the 2018 Season”

Analyzing AL- and NL-Only Standings Data

As much as I love the standings gain point approach to valuing players, it does have an a couple of inherent weaknesses.

First, it’s dependent upon some form of league history to work. The whole ranking and valuation process is derived from previous standings data! Those starting new leagues, or joining an existing league, don’t have this information available.

Second, assuming you have prior standings to draw from, I’ve always been bothered by the small sample sizes of that data. And I don’t know about you, but something odd always seems to happen in my leagues. One year someone runs away with it, one year it’s a tight race between five teams, one year we add two teams, the next year we contract a team.

What are we to do?!?!

Thank You OnRoto and NFBC

Thankfully, some very generous league hosting sites have made their standings information publicly available or shared it with me! With their help, I think we can put to bed the concerns over lack of league history and small sample sizes. We have MANY leagues to look at now.

The fine folks at OnRoto.com have shared their NL- and AL-only standings data. If you’re not familiar with OnRoto, their goal is to cater to sophisticated fantasy leagues, many of which play by the “old-school” rules required by “long-term players”. They also are willing to fulfill just about any customization request (more on this later!).

I’ve also written several times about NFBC standings data for mixed leagues.

What follows is a close look at the 2016 12-team “only league” data from OnRoto. If you’re curious, you can see the 2015 AL information here and the 2015 NL information here.

Now, let’s take a look at the data!

AL-Only Standings by Category

Here are the average AL statistics within each rotisserie scoring category:

RK PTS AVG R HR RBI SB ERA WHIP W K SV
1 12 0.272 987 291 964 128 3.583 1.191 94 1,311 90
2 11 0.268 945 274 926 115 3.753 1.227 88 1,271 79
3 10 0.266 917 262 894 107 3.856 1.245 85 1,229 72
4 9 0.264 889 254 867 100 3.934 1.258 82 1,194 64
5 8 0.262 867 245 846 94 4.014 1.271 80 1,159 57
6 7 0.260 844 236 823 89 4.079 1.286 77 1,133 52
7 6 0.259 824 227 793 83 4.160 1.298 74 1,108 46
8 5 0.257 804 217 773 78 4.225 1.310 72 1,083 40
9 4 0.255 777 207 747 73 4.280 1.322 70 1,048 36
10 3 0.253 743 195 714 67 4.386 1.339 66 1,005 30
11 2 0.250 711 184 681 61 4.525 1.360 61 961 21
12 1 0.246 636 162 604 49 4.728 1.392 55 901 11

To better explain what you’re looking at, a team could have finished in 10th place in the standings but still finished 1st place in the home runs category. That team’s data appears on the “Rank 1” row, not on the “Rank 10” row.

NL-Only Standings by Category

And here are the NL stats:

RK PTS AVG R HR RBI SB ERA WHIP W K SV
1 12 0.276 950 257 915 164 3.411 1.183 93 1,354 88
2 11 0.272 917 244 879 143 3.596 1.217 86 1,284 76
3 10 0.269 883 231 845 133 3.710 1.232 82 1,234 68
4 9 0.267 863 222 816 122 3.810 1.253 79 1,192 61
5 8 0.264 840 214 798 112 3.902 1.270 75 1,155 54
6 7 0.263 813 206 775 106 3.994 1.284 73 1,125 49
7 6 0.261 787 198 743 99 4.080 1.297 70 1,093 44
8 5 0.259 763 191 718 92 4.173 1.313 66 1,062 37
9 4 0.258 740 184 692 85 4.241 1.329 63 1,026 33
10 3 0.255 703 174 660 78 4.351 1.347 60 991 27
11 2 0.252 673 160 630 70 4.445 1.372 55 945 20
12 1 0.249 618 143 570 56 4.631 1.406 48 826 11

Continue reading “Analyzing AL- and NL-Only Standings Data”

Standings Gain Points for NFBC Leagues

In the post that follows, I’ll share standings gain points (SGP) factors for the NFBC Main Event, NFBC Draft Championship, and NFBC Online Championship for each of the last five years (2012-2016). But I’ve got to lay some groundwork before we get there…

Raw vs. Relative

While the discussion is a bit lengthy, I think this article discussing “raw” and “relative” SGP contains one of the most significant realizations I’ve had in fantasy baseball.

The quick and dirty explanation of this realization is that it is not only the raw SGP factors (or denominators) that drive player value calculations. The relationship, or relative value, between the SGP factors is also meaningful. Not only that, but looking exclusively at raw factors can be misleading, as it is difficult to see these relationships.

To illustrate, here are two example sets of raw SGP factors for a league:

League BA R HR RBI SB
2013 15-team NFBC Main Event 0.00161 13.751 5.533 15.115 6.228
2016 15-team NFBC Main Event 0.00150 15.366 6.561 16.838 6.375

I refer to these as raw factors because they’re calculated using the standard process prescribed by SGP. A calculation is made for each scoring category and those numbers are then fed into the process that’s used to rank or assign dollar values to players.

Looking again at the table of raw data above, you might think, “Wow, what happened in the last three years that caused those significant changes in the SGP factors?”

You might even start spewing some narrative about the changing landscape of baseball, the rise in strikeouts, and the power surge MLB experienced last season.

But before you start that process, let’s take a look at those same sets of SGP factors, after they’ve been converted into relative form:

League BA R HR RBI SB
2013 15-team NFBC Main Event 0.00011 0.90976 0.36609 1.00000 0.41202
2016 15-team NFBC Main Event 0.00009 0.91256 0.38963 1.00000 0.37862

The numbers still fluctuate. And if you run the math, from 2013 to 2016 the categories changed about 10%, on average, in both the raw and relative calculations. But seeing the factors in relative form really gives me a lot more confidence in my calculations.

I was always wondering if I screwed up my calculations before making this realization. “Could RBI really have changed that much?”

To be clear, I did not develop this way of looking at the numbers. I made the realization after reading “Winning Fantasy Baseball” by Larry Schechter. Although I didn’t invent this approach, I continue to share it because I think a lot of folks are confused by the raw numbers and this confusion leads to decreased confidence in the SGP approach.

How to Calculate Relative SGP

Continue reading “Standings Gain Points for NFBC Leagues”

How to Analyze SGP Denominators from Different Sources

Do you know if the SGP calculations you’ve done for your league are accurate?

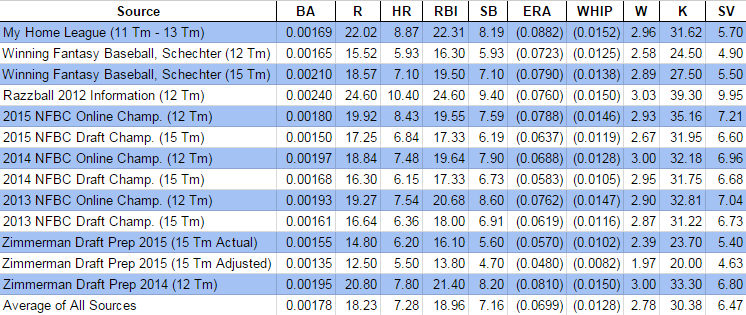
Are you concerned that your home run SGP denominator is 8.87 and Larry Schechter’s book Winning Fantasy Baseball suggests using 5.93 for a 12-team league? Or that your RBI calculation shows 22.31 and the 12-team NFBC history I just calculated shows 19.55?

What does this all mean? Will your rankings be accurate? How can they be when your denominators seem significantly different than those you see elsewhere?

Calm Down, These Numbers Are More Consistent Than You Realize

I know. You’re wondering how on Earth I can say that. How can a HR denominator of 8.87 be consistent with one of 5.93?

To be honest, I’ve had those same fears about SGP. I feel so scientific and strategic by calculating SGP. And then I look at my denominators in comparison to what I see published elsewhere and that confidence evaporates and is replaced with doubt.

In this post I’m going to share an important realization I just had about SGP (yep, I’m still learning too), show you how to properly compare your SGP denominators to different resources, and demonstrate that the dollar values calculated by different sets of denominators are more similar than you would believe. When we’re done here, I think we’ll all feel a lot more comfortable about things.

Story Time

This story starts with me calculating the SGP for the last three seasons of NFBC leagues (which make their standings information publicly available).

I read Winning Fantasy Baseball a couple years ago (if you haven’t read it and you’re about to read 2,500 words on SGP denominators, you really should get the book), and I vaguely remembered the book giving SGP denominators for a variety of league types. I wanted to verify that my findings were similar to Schechter’s.

Here’s what I found:

Source BA R HR RBI SB
2015 12-team NFBC Online Championship 0.00180 19.92 8.43 19.55 7.59
Winning Fantasy Baseball 12-team League 0.00165 15.52 5.93 16.30 5.93

Damn. WTF does this mean? Those don’t look close to me. Did I do something wrong?

A Very Important Point

As I looked more closely at the book, I noticed I missed a very important point the first time I read it. Next to each number, Schechter had calculated a “relative SGP value”.

SGP Type BA R HR RBI SB
Raw SGP Denominator 0.00165 15.52 5.93 16.30 5.93
Relative SGP Denominator n/a 1.05 2.75 1.00 2.75

And here’s the important point Schechter makes about these calculations:

… when you’re trying to adjust SGPs for leagues of various sizes, it’s important to realize that the raw value of the SGP isn’t very important, but rather the ratio of the values.

~ Larry Schechter, Winning Fantasy Baseball

Mine Is Bigger Than Yours Is

I glossed over that red bolded sentence on previous reads (because it’s not bolded red in the book…). But this small statement buried in the middle of the 350-page book is exactly the point I needed for the self-doubt I was experiencing.

So in order to hopefully save you the same trouble, take note! You can’t compare your SGP denominators to someone else’s. You have to convert them to a relative scale first.

Raw Versus Relative – An Example

Let’s focus in on just the HR and RBI stats from the table above.

SGP Type HR RBI
Raw SGP Denominator 5.93 16.30
Relative SGP Denominator 2.75 1.00

If it takes 16.30 RBI and 5.93 homers to move up the standings, this essentially means that one home run is 2.75 times more important than one RBI (home runs are more scarce, so getting one of those is more valuable than the more common commodity, RBI).

16.30 / 5.93 = 2.75

Do you remember working with fractions in elementary school? I liken this practice to that whole “lowest common denominator” charade we had to go through. Dropping the SGPs to a relative scale is like converting them to a lowest common denominator. If you leave the SGP factors grossed up at these high numbers (like 5.93 and 16.30), it’s more difficult to see the relationships you can see when they’ve been translated into the relative scale.

One More Math Concept

If you read Using Standings Gain Points to Rank and Value Fantasy Baseball Players or if you’re generally familiar with the SGP approach, you know that we would divide a player’s home run total by the home run “SGP denominator” to know how many SGP the player contributes due to his homers.

For example, if a player is projected by 30 home runs, an SGP denominator of 5.93 would indicate the player’s homers are worth 5.1 points in the standings (30/5.93=5.1). If the same player is projected for 83 RBI, an SGP denominator of 16.30 suggests the RBI are also worth 5.1 SGP (83/16.30=5.1). The 30 HR are worth the same as 83 RBI (5.1 SGP).

However, the way Larry Schechter has calculated his relative SGP would require you to multiply a player’s stats to achieve that same equality. For example, the 30 HR multiplied by 2.75 is 83 “points”. The 83 RBI multiplied by 1.00 is also 83 “points”. The 30 HR are worth the same as 83 RBI (83 relative SGP).

For Consistency, I Will Calculate Relative SGP Another Way

If you look back at the big bolded numbers above, Larry Schechter used the largest statistic (RBI for hitters and K for pitchers) as the numerator in his conversion. I will use it as the denominator.

5.93 / 16.30 = 0.364

I’m mostly doing this because everything I’ve written about SGP to this point tells you to DIVIDE BY THE SGP DENOMINATOR (heck, it’s called a denominator, meaning it’s on the bottom of the fraction). To now tell people to MULTIPLY BY THE RELATIVE SGP DENOMINATOR seems too confusing to me.

I’m sure I’ve confused the hell out of everyone at this point either way. And I apologize for this. But I think this topic is very important to understand. I’m giving it my best! Even if you’re confused, keep reading. I think this will all pull together very nicely in the end.

Going back to our example of a player with 30 HR and 83 RBI, if I divide by an SGP denominator of 0.364 I get that same 83 “points” (forgive the rounding), meaning the 30 HR are worth the same as the 83 RBI under this approach. So whether you use Schechter’s relative numerator and multiply or my relative denominator and divide, you get the same results.

How to Calculate “Relative” SGP Denominators

I’ve talked a lot about multiplying and dividing. So just to be clear, to put your SGP denominators on the same relative scale, choose the category with the largest numeric value, then divide each stat categories raw SGP denominator by that largest raw SGP denominator.

The largest numeric denominator is typically RBI for the hitting categories (the 16.30 from above is the largest SGP denominator) and strikeouts for pitching.

For the rest of this post I will be using this calculation of relative SGP denominators and NOT the way suggested in Winning Fantasy Baseball.

My NFBC Relative Versus Winning Fantasy Baseball’s 12-team Relative

Using the method described above, I calculated the relative denominators for Larry Schechter’s 12-team suggestions and my 2015 NFBC findings. Here are the results:

WINNING_FANTASY_BASEBALL

First look at the white lines. These give me that queasy feeling I was describing earlier. He’s saying 5.93 HR for a 12-team league? And I came up with 8.43? That’s 2.5 HR difference. How can these suggestions even be in the same ballpark?

Now look at the yellow-shaded lines. After everything is put on the same scale things look a lot more reasonable. When you look at all items on a relative scale, you can see many of the categories are strikingly similar (BA, R, RBI, SB, K, SV), but still show small variations. There is some variance in the other categories, but things don’t look as stark as with the raw denominators. This supports our beliefs about SGP being able to “tailor” to our league tendencies and preferences, but still leaves me feeling a lot more comfortable that my denominators are in fact closer to Larry Schechter’s than it appears on the surface.

Right around this time I’m starting to feel more comfortable with my analysis. But I’m also very curious about what happens if I start looking at SGP denominators from other sources. So I set out to find as many sources as I could find.

NOTE: After publishing this article, it came to my attention that there’s a typo in Winning Fantasy Baseball that makes this last segment somewhat less relevant. I’ve elected to keep it in despite this.

Other SGP Denominator Sources

The reliable sources I was able to locate for this analysis are:

Not bad. I was able to scrape up 13 different resources for comparison. And I threw in the average of those 13 resources as my 14th.

Here’s the Raw SGP Data

You can see things are all over the map. You can see general patterns, but the data fluctuates wildly. Some of the raw SGP denominators are almost double others. For example, Larry Schechter’s 12-team HR denominator is 5.93 while Razzball’s 2012 article calculated a 10.40!

And Here’s the Relative SGP Data

Continue reading “How to Analyze SGP Denominators from Different Sources”
How to Project Plate Appearances

Projecting X Mike Podhorzer
Click here to create your own player projections.
Going through the process of projecting individual players is one of my favorite parts of the year. I started creating my own projections two seasons ago, using Mike Podhorzer’s book Projecting X.

There are parts of the projection process I feel very comfortable with. I can look at a player’s recent plate discipline, batted ball mix, and power ratios to arrive at an accurate projection for most of that player’s stat line…

But when it comes to projecting playing time, I feel like I’m throwing darts with a blindfold on. How can I realistically make a determination between 675 PAs and 690 PAs?

Until now, I’ve really just relied upon a player’s recent seasons and used qualitative information about injuries, role on the team, and playing time competitions to come up with an estimate for total plate appearances.

Thankfully, a reader of the site recently commented on a post I wrote about the effect of batting order on runs and RBI, and his question helped me arrive at the much more sound approach for projecting playing time I’m about to share with you. Here’s his question:

Interesting stuff. In your research, I am wondering if you happened to look at Team Runs/Plate Appearances on a per game basis?

That is, if a team scores Y runs in a game, what would you predict their Team PAs to be. Something like Y = Ax + B.

~DMM

That question got the wheels turning in my rapidly deteriorating middle-aged brain… There have to be better ways to think about playing time. And I certainly need to take the team’s overall run scoring into account.

Team Plate Appearances vs. Team Runs

To answer the question, I downloaded the last ten years of MLB team offensive stats from Baseball-Reference.com (click here to see the data).

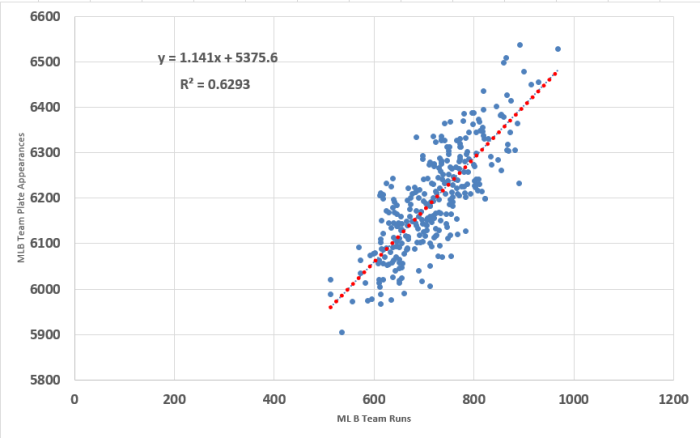
Then I created a scatter plot in Excel by graphing team runs against team plate appearances.

TEAM_RUNS_VS_PLATE_APPEARANCES

I’ve mentioned it many times on the site already. I’m no statistician. I don’t play one on TV. And I’m not pretending to be one on the internet. I am squarely in the area of having enough knowledge about statistics to offer no help but to only be dangerous. With that amazing qualifier I’ll try to explain what you see in that chart above.

Each of the blue dots represents one team’s season in the last 10 years (2006-2015). For example, the dot in the top right corner is the 2007 Yankees, who scored 968 runs (holy crap, A-ROD!).

The dotted red line represents a trend line or line of best fit. It’s the best estimate of the relationship between team runs scored and team plate appearances. The equation on the graph is the formula used to chart out the red line and is the exact answer to reader DMM’s question (where x is team runs scored and y is team plate appearances).

y=1.141x+5375.6

I suppose that could be helpful at the daily game level too. That equation would become y=0.007x+33.18 if you were trying to project a team’s plate appearances in an individual game (where x is runs per game, not season-long runs).

Projecting Individual Plate Appearances

That answers the original question. But I still wasn’t quite satisfied with stopping there.

Sure, it’s helpful to know that if I think Angels will score 700 runs that I should project that whole team for about 6,175 plate appearances (5,375.6 + 1.141 * 700 = 6,174.3). But what does that mean to Mike Trout if I think he will bat second in the lineup? And what if I think he’ll bat third?

Is there a way to add a third variable to the chart above? So we can see how leadoff hitters on teams scoring 700 runs have fared? Or how cleanup hitters on teams scoring 800 runs have performed?

The Data

Baseball-Reference has a really interesting split table that shows the hitting stats each team had from each spot in the lineup (click here to see Kansas City’s 2015 team split).

Kansas City Royals 2015 team batting splits

I downloaded that split table for all 30 teams for each of the last 10 seasons (300 CSV files!). You can see all the raw data here. Again, thanks to Baseball-Reference for making this data available.

Then I grouped the data by team runs scored, putting teams into categories of 500-549, 550-599, 600-649, 650-699, 700-749, 750-799, 800-849, 850-899, 900-949, and 950-999 runs. Here’s a table showing the number of teams in each of these categories for the AL and NL:

Runs Scored AL Teams NL Teams Total
500-549 1 2 3
550-599 2 7 9
600-649 19 34 53
650-699 23 33 56
700-749 33 43 76
750-799 30 25 55
800-849 19 9 28
850-899 12 4 16
900-949 3 0 3
950-999 1 0 1

Continue reading “How to Project Plate Appearances”

How Does a Player’s Age Affect Draft Return?

A few weeks back I took a closer look and analyzed the last five years of preseason Steamer projections (what I’m using as my best approximation of the “draft value” of each player heading into the season) and compared them to the actual end of season dollar values earned by those same players.

One of the glaring omissions in that article was some kind of analysis by age.  Are there certain age groups that might be undervalued?  Better yet, are there certain age groups of hitters we can take advantage of and a separate age group of pitchers we can jump on?

If we are trying to decide between a $20 pitcher who’s 23 years old or a $20 pitcher who’s 33 years old, who should we choose?

Quick Reminders

I’d highly recommend reading the first article that started me down this road.  There’s a greater explanation of the approach used.  But for a quick reminder… the dollar values are based on a standard 12-team league using traditional rosters (2 catchers, 14 hitters, 9 pitchers) and the standings gain points approach.

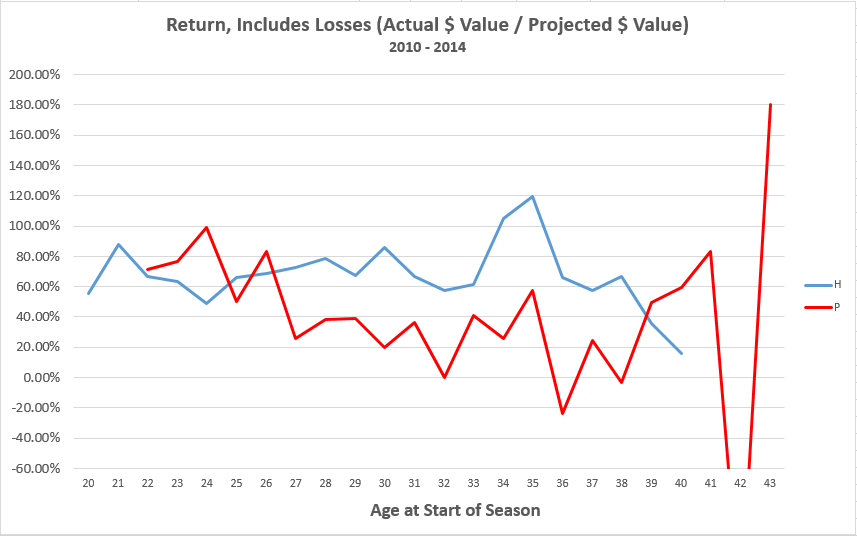
I also calculate return “including losses” and “without losses”.  The best way to think about this is with a pitcher suffering a terrible injury in the first month of the season.  Being injured that early, regardless of how good the pitcher is, will result in negative earnings.  But the “benefit” of an injured pitcher is that you can immediately drop them and not suffer any of those negative earnings.

The flip side of that coin is with a struggling pitcher.  You may decide to stick with a struggling pitcher for weeks or months, hoping for them to turn it around.  In this scenario you are saddled with many of the negative earnings for that player.  So the actual “return” on players lies somewhere between the “including losses” and “without losses” results.

Draft Results By Player Age

Take a look at the “Including Losses” and “Without Losses” charts below.  Does anything jump out at you?

RETURN_BY_AGE_WITH_LOSSES Continue reading “How Does a Player’s Age Affect Draft Return?”

Analyzing the Last Five Years of Rotisserie Baseball Drafts

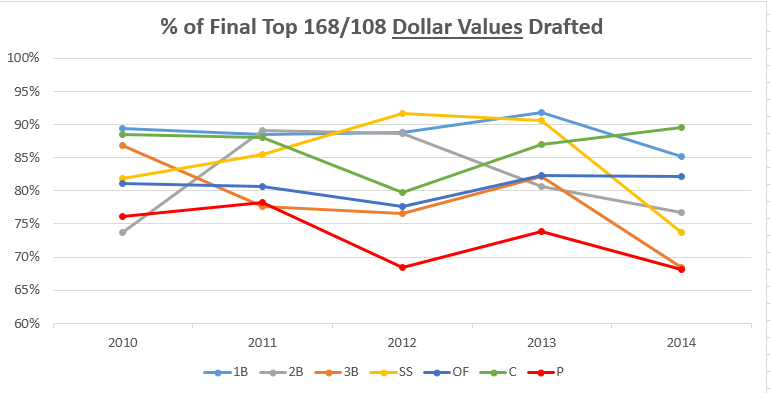
How many of the top hitters and pitchers at the end of the year were actually drafted? How many of the top hitters and pitchers were not drafted and were picked up during the season?  Were hitters or pitchers drafted more accurately?  What is the dollar value earned by the players that were picked up during the season?  Is there a position of hitter that’s more reliable than other positions?

Have you ever asked yourself draft analysis questions like these?

What follows is a five year analysis (with colorful graphs and an enormous Excel file!) of how accurately our projections in the preseason depict what has actually happened at the end of the season. How well we drafted.  What positions yield the best returns.  What positions offer the most free loot.  And more.

Assumptions You Should Know

A number of the graphs depend on dollar value earnings for the “top 168” projected hitters or “top 108” projected pitchers.  The dollar values are calculated using the approach documented in “Using Standings Gain Points to Rank and Value Fantasy Baseball Players” assuming a 12-team league, $260 team budget, 14 hitters (C, C, 1B, 2B, SS, 3B, CI, MI, OF, OF, OF, OF, OF, UTIL), 9 pitchers, and a 70%-30% hitter-to-pitcher allocation.  That’s a total of 168 hitters and 108 pitchers.

These top projected players in the preseason were determined using Steamer’s preseason projections for that season (I downloaded the historical projections here).

I suppose using ADP results or expert rankings from the given year might give a better picture of the players that were actually drafted, but then you get into the question of what’s good ADP data, where to get it, what experts to use, league differences, lineup differences, etc.

To Be Clear…  The Goal of this Study

The goal of this is not to measure the accuracy of particular experts.  It is to determine which positions can we draft and get the most return on our investment.  To some extent this is a review of Steamer’s accuracy, but that’s also not my intent.  It’s my understanding (tell me if I’m wrong) that there are not significant differences between the top projections systems.  So whether we were looking at PECOTA, Steamer, or Marcel projections, we would see similar results.

How Much of a Return Do We Get For Drafting HItters vs. Pitchers?

People have long been telling us to, “Load up on hitters early in the draft”.

“Don’t overspend on pitching.”

“Wait on pitching until most teams already have one.”

I’ve always heard these things.  They sounded right.  But I can’t say I’ve ever seen the data to support it.

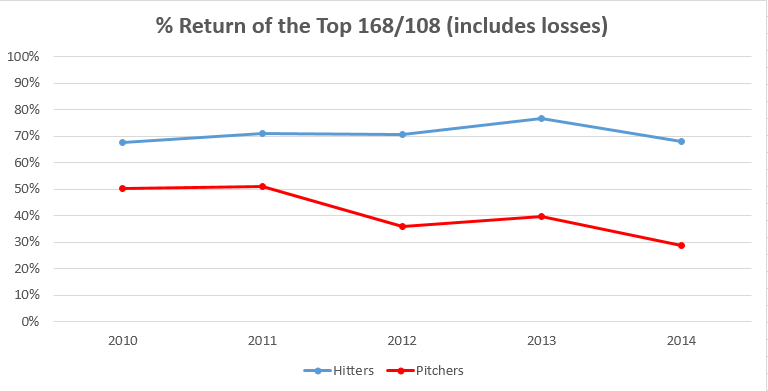
In looking at the chart below it is very clear that we are much better at identifying the top hitters than the top pitchers.  The top 168 hitters in the preseason provide about 70% of the dollars earned at the end of the season.  For pitchers, it’s more in the neighborhood of 40%.

With results like that it’s very easy to see why the hitter-pitcher split is not 50-50.

Hitters are safer investments than pitchers.  We’ve always been told this, but now you can see it.  And things have not changed in the new era of pitching that we’ve been seeing the last few years.  If anything, the gap seems to have widened.

Hitter-Pitcher-Draft-Returns-With-Losses
In a draft and hold environment, the return on investment for drafting hitters fluctuates between 65% and 80%. The return on pitchers is much lower, falling roughly between 30% and 50%.

Continue reading “Analyzing the Last Five Years of Rotisserie Baseball Drafts”

Should You Combine Multiple Projection Systems Into One?

Should I use this projection system or that one?  Why mess around with the second best system if you can easily determine the best, right?

If you search the web, you can locate previous studies that review the accuracy of baseball’s many projection models.

I Don’t Have Time To Read All That.  Just Tell Me what They Say.

Understood.  Here’s my summary:

  • There area lot of different approaches to projecting stats (Marcel, Steamer, Zips, Oliver,PECOTA, etc.)
    • Basic three year weighted average with regression to league average
    • More than three year weighted averages incorporating more advanced component metrics
    • Crowd sourcing
    • Aging curves
    • Similar player modelling
  • No single projection system is consistently better than the others in all the stat categories we care about for fantasy baseball
  • The most accurate projection model changes from year-to-year
  • But there are some that consistently perform well
  • Some systems do well in projecting offensive statistics
  • Some are better at pitching

What Is Also True

A lot of research has been done on the effectiveness of combining or “aggregating” different projections or forecasts into one.  This research was not done with only fantasy baseball in mind, but we can take advantage of it.  Here’s one very interesting article on the topic (it’s from a website named “forecastingprinciples.com” and is a PDF of a study from the Wharton School of Business at Penn, it has to be legit, right?).

The thinking behind aggregating projections is that the wisdom of many intelligent people looking over a lot of information can lead to better results than just one isolated model for projecting future results.  When you combine all of this together you’ll naturally be removing the outliers from the individual models, but hopefully you’re also improving the accuracy as a whole.

The Actual Results

It may not be appropriate to boil a 15 page research paper into a couple of sentences.  But I’m going to do it anyway!  Here’s what the PDF linked above concludes on the evidence on the value of combining forecasts: Continue reading “Should You Combine Multiple Projection Systems Into One?”

How Much Do Current Season Stats Matter?

Every major fantasy league hosting site (Yahoo, CBS, ESPN) allows you to look at recent history (e.g. the last 7 days or the last 14 days).  It’s also very easy to see the year-to-date stats any player has accumulated to this point in the season.

Yahoo_Stats
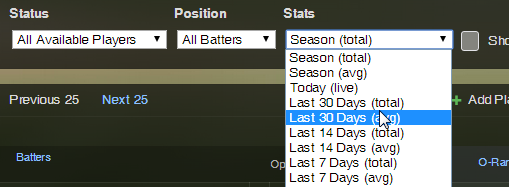
The Yahoo! free agent list allows you to look at the last 7, 14, and 30 days.

And now that we’re nearly half way through the current season, how much do those current year stats mean?  If you’re trying to add a free agent, should you be looking at the last 7 days?  Is the last month OK to use?  How much can we expect production from the first half of the season to continue into the second half?

CBS_Stats
CBS allows you to look at 7, 14, 21, and 28 days, as well as 3 year averages.

Let’s Take A Quiz

Before we get to the answers to those question, let’s put you to the test with some very specific questions.  I’ll lay out a series of “story problem” (remember middle school math?) questions for you .  Place yourself in each situation and make what you think is the best fantasy baseball decision.

Question #1

Your team recently suffered an injury and you must go out to the free agent list and find a replacement.  Which of these measures is the best method of identifying the player who will perform the best for the rest of the season?

  1. Looking at the statistics for free agents in the last 7 days
  2. Looking at the statistics for free agents in the last 14 days
  3. Looking at the statistics for free agents in the last 28 days
  4. Looking at the statistics the free agents have accumulated to this point in the season (season-to-date stats)
  5. Looking at the projected statistics for free agents for the remainder of the season  (like Steamer or Zips rest-of season projections)

Question #2

Which model(s) above do you actually use to make decisions?

Question #3

Which player would you rather have the remainder of the season given these levels of production so far?

Current production (as of 6/22/2014):

Player PA R HR RBI AVG
Nelson Cruz 306 45 23 60 .299
Chris Davis 252 32 12 37 .220

Question #4

Which player would you rather have the remainder of the season given these levels of production and the Steamer RoS projections below?

Current production (as of 6/22/2014):

Player PA R HR RBI AVG
Nelson Cruz 306 45 23 60 .299
Chris Davis 252 32 12 37 .220

Steamer RoS Projections (as of 6/22/14):

Player PA R HR RBI AVG
Nelson Cruz 320 41 17 47 .261
Chris Davis 341 46 20 52 .261

Question #5

Similar scenario to question four above…  But now imagine that we’re five full months into the season instead of at roughly the half way point.  Who would you rather have in the final month of the season?

  • The player who was incredibly hot for the first five months but that projections say will cool off towards his career averages or
  • The player that has struggled for the first five months but is projected to improve and perform closer to his higher level of career averages over the final month of the season?

Question #6

Which player would you rather have the remainder of the season given these levels of production and the Steamer RoS projections below?

Player IP K/9 ERA WHIP
Andrew Cashner 76.1 6.96 2.36 1.19
Homer Bailey 90.0 8.07 4.68 1.45

Steamer RoS Projections (as of 6/22/14):

Player IP K/9 ERA WHIP
Andrew Cashner 103.0 7.29 3.85 1.27
Homer Bailey 95.0 7.99 3.80 1.22

The Research

The information that follows Continue reading “How Much Do Current Season Stats Matter?”