Cautionary Notes About Sample Size Stabilization Points

In this post I’m going to try to tie a pizza utensil, Bill Murray, and Charlie Blackmon together all while trying to help you avoid a pitfall I think many are making in their fantasy baseball research.

Read enough fantasy baseball advice and you’re bound to come across something like this:

We can now trust player x’s <insert rate statistic here> because he’s reached the number of plate appearances for the stat to become reliable.

Or maybe this:

We’ve reached the point of the season where <insert rate statistic here> starts to stabilize.

Maybe you even clicked on a link near the comment, saw some fancy tables with a lot of other stats and when they “stabilize”, references to r-squared, and then concluded, “Seems legit to me.”

These comments are usually followed by some kind of analysis that uses the stat in order to project into the future.  This is the problem!  More on that in a bit.

Not So Fast My Friend

I’ve long been a victim of this.  I’m not a statistician, so if I someone makes claims like this and links to a study that looks legitimate at a quick glance, I’ll buy into it.  This seemed even more reliable because the study is quoted at a lot of reputable sites like Fangraphs, Beyond the Box Score, and more.

But I’m also a regular listener of Fangraphs’ “Sleeper and the Bust Podcast” with Eno Sarris and Jason Collette. I’ve heard Sarris mention a disclaimer several times when referring to sample size stabilization points that has always left me a little unsettled. So I decided to investigate.

A Little History

The original study was performed in 2007 by a man writing under the name “Pizza Cutter”.  It’s a heavy load of information to consume, but I do recommend it so you can understand how he performed the test.  Plus, it’s proven to be a very popular piece of reference material, so it wouldn’t hurt to familiarize yourself with it.

You can’t really tell from the original study, but it turns out that the research has been misused and misinterpreted by many people.  So much so that Pizza Cutter himself has since written several times that his work is being misused.

These Stats Are Not Predictive

Russel A. Carleton, who ditched the Pizza Cutter nickname (except on Twitter), is the man behind the stabilization points research.  He has this to say about the predictive value of stabilization points:

…they are not nearly as powerful in predicting the future as people seem to believe that they are.

And it makes sense.  When developing projections before the season starts, the typical projection system uses at least three years of data.  So then why are we so quick to believe that three weeks of April at bats are meaningful at predicting the rest of the season!?!?!

When referring to an example of how his study is used to say, “this new strikeout rate that we’ve seen is what we can start to expect”, Carleton writes,

That’s not what the study was actually about.

If you haven’t gone and read the article yet, I do recommend it.  You can just sense the angst in Carleton’s writing.  The title of the article, “It Happens Every May”, speaks volumes.  I can just see Carleton surfing the web as we speak reading countless articles inappropriately referencing his work and thinking to himself, “Every season I have to put up with this $#!_”.

It Helps To Understand What Carleton Was Trying To Do

Carleton wasn’t trying to develop a projection methodology in doing this research.  He states that one of his favorite things to do is to make up his own statistics and study if they correlate to other metrics we already use in baseball research.

It doesn’t make sense to do advanced baseball research on small sample sizes.  So all he wanted to know was how soon into a season, or with how small of a sample size, could he begin conducting these studies of his.

What Stabilization Points Really Mean

Continue reading “Cautionary Notes About Sample Size Stabilization Points”

You Need To Read This If You Play In a Two-Catcher League

In this post I’m going to demonstrate why you can’t simply rely upon the rankings information you find online.  Widely available rankings do not account for the intricacies of your league.  These differences can lead to large swings in the valuations of players.

You should be calculating your own rankings specific to your own league format, especially if you play in a two-catcher league.  There is a valuation problem waiting to be exploited in two-catcher leagues.  

Please make sure you read to the end.  I get a little carried away with examples below, but there are some important conclusions at the end.

This Is Not a Lie

When I run Steamer’s 2014 projections through my ranking system, Buster Posey and Wilin Rosario come out as top 10 players.

Let that sink in.  In all the draft preparation and rankings articles you’ve read so far, have you seen any catcher crack the top ten?

You’re a Moron.  Your Ranking System Must Be Wrong.

Before you dismiss this out of hand, let’s work through a little exercise.  As with most scenarios I outline at this site, let’s assume a 12-team mixed league using standard 5×5 rotisserie categories, 14 hitters (2 C, 1B, 2B, SS, 3B, CI, MI, 5 OF, UTIL), 9 pitchers, and no bench. This would mean 24 catchers would be drafted, 60 OF, and 168 total hitters.

So as not to pick on any one analyst, I’ll be referring to the consensus fantasy baseball hitter rankings that FantasyPros.com puts out (if you don’t use this tool, it’s pretty neat.  You can instantly average the rankings of your favorite analysts).

As of March 10th, Buster Posey comes in as the top catcher and 36th ranked hitter.  Matt Holliday comes in as the 35th ranked hitter.

Matt_Holliday_Buster_Posey

Let’s say Team A drafts Holliday and with the very next pick, Team B drafts Posey.

If a ranking system were really accurate, you would think the combined stats from Holliday (the 35th ranked player) and Team A’s final draft pick should be very similar to the combined stats of Posey (the 36th ranked player) and Team B’s final draft pick.

Let’s Take a Look

Because Team A passed on Posey, let’s assume they decide to wait until the last round of the draft to fill their second catcher slot by taking the 24th ranked catcher.  In those same consensus rankings, the 24th catcher is Welington Castillo.

Wellington_Castillo

And because Team B wasn’t able to take Holliday with their pick, they decide to wait until the last round to draft their fifth outfielder.  When the time comes, Team B selects the 60th ranked OF (12 teams * five OF per team).  The consensus rankings tell us Kole Calhoun is that guy.

Kole_Calhoun

So Team A ends up with Holliday and Castillo.  Team B ends up with Posey and Calhoun. Applying Steamer’s 2014 projections to these two teams we get:

Player AB H AVG HR R RBI SB
Holliday 530 152 .287 22 78 81 4
Castillo 365 92 .252 12 41 45 2
Total Team A 895 244 .273 34 119 126 6
Player AB H AVG HR R RBI SB
Posey 557 165 .296 20 78 84 2
Calhoun 529 141 .267 17 72 69 11
Total Team B 1,086 306 .282 37 150 153 13

Wow.

Team B wins every category.  The reason for this is the concept of the replacement level players.  The 60th (last picked) OF is still pretty productive, whereas the last catcher selected is a problem.

Maybe Posey should be ranked higher if he gives you that big of an advantage.

You Cherry Picked This Example.  No Way Does This Work Out Like This Every Time.

It is very possible Calhoun is also slanting the results.  When I run his Steamer projection through my ranking system he comes out as the 41st OF (so the consensus rankings are underrating him by ranking him the 60th OF).  I think he’s a terrific sleeper.  So let’s drop twenty three more spots down to Gerardo Parra.

Why Parra, you ask?  Well, he does come out as the 60th best OF when I run the 2014 Steamer projections through my ranking calculations.  He’s ranked the #83 OF in the FantasyPros consensus ranks.

Gerardo_Parra

It would seem that dropping 23 spots further should affect things significantly.  But let’s take a look:

Player AB H AVG HR R RBI SB
Holliday 530 152 .287 22 78 81 4
Castillo 365 92 .252 12 41 45 2
Total Team A 895 244 .273 34 119 126 6

Continue reading “You Need To Read This If You Play In a Two-Catcher League”

2014 Mock Draft – Tulowitzki or Hanley?

I recently participated in a 2014 mock draft with representatives from BaseballProf.com, BaseballPress.com, FantasyBaseballCrackerJacks.com, and Razzball.com.  Mock drafts at this point in the offseason are to be taken with a grain of salt (the draft was completed before the Fielder-Kinsler trade and before any free agency signings occurred).  But it was a very interesting exercise in seeing how perceptions of players have changed after the 2013 season.

My First Round Pick Raised Some Eye Brows

I had the eighth pick.  And as you can see from the results, the first six picks went as you might expect with names like Trout, Cabrera, Cano, and Goldschmidt.

Troy Tulowitzki was picked seventh, right before me (this is important, remember this).

Then it came to me and I was faced with a very difficult decision.  As a subscriber to the belief that, “You can’t win the league with your first pick, but you can lose it”, I typically preach being conservative in the first round.  But there was nothing “conservative” about the batch of players sitting before me:

  • Ryan Braun (PED risk)
  • Joey Votto (unspectacular of late)
  • Adam Jones (can’t argue with the production, but plate discipline bothers me)
  • Chris Davis (.240 batting average risk?)
  • Clayton Kershaw (too early for me at eight)

So I chose Hanley Ramirez.

The Response

To say the pick has been questioned by some is a bit of an understatement.  I was called out, labelled a masochist, and called crazy (30:40 mark).

Granted, I think these things were all said in jest. But I don’t think any other pick in the draft earned comments like these.

I Don’t Get It

I completely understand this being considered risky.  And I can buy into the argument that eighth is too early.  But let’s put that aside for now and debate something that I think is being overlooked.

I am surprised that nobody questioned the pick of Troy Tulowitzki just one pick earlier! I think Hanley Ramirez is the number one shortstop for the 2014 season.  Not Tulo.

Let’s go through the possible counterarguments.

Hanley Ramirez is Injury Prone

May I present to you games played, by season, for Tulowitzki and Ramirez:

Season Tulowitzki Ramirez
2006 n/a* 158
2007 155 154
2008 101 153
2009 151 151
2010 122 142
2011 143 92
2012 47 157
2013 126 86
Average 120.7 136.6

*This was Tulowitzki’s rookie year.  He did play in 25 MLB games, but I exclude it from the average because he didn’t play a full year and it was not due to injury.

There’s a perception out there that Hanley Ramirez is injury prone.  That should be revised to state that he has experienced significant injury problems in two of the last three years.  He’s been dependable the rest of his career.  And much more dependable than Tulowitzki.

Tulo has only surpassed the 140 games played threshold three times in seven years! That’s six out of eight for Hanley.

The two seasons Ramirez did not reach the 140 game mark were due to shoulder surgery and a thumb ligament injury.  I have nothing to back this up, but those don’t indicate “injury prone” to me, whereas Tulowitzki’s leg injuries do earn him the “injury prone” label in my mind.

Hanley Ramirez Is Getting Old.

He’s currently 29 and will be 30 during the 2014 season.  Tulowitzki is only 10 months younger.

Hanley Can’t Repeat His 21% Home Run per Fly Ball Rate

Continue reading “2014 Mock Draft – Tulowitzki or Hanley?”

Be A Contrarian… Zag

In this post I am going to share with you one of the simplest and most effective fantasy baseball strategies you can implement.  You’re already aware of the strategy, but I’m going to dive a little deeper and dissect it into two components.  One to apply during the off-season and one for during the season.

Teach A Man To Fish…

“The fishing is the best where the fewest go…” ~ Timothy Ferriss

I cherry picked this quote from Timothy Ferriss’ book, “The 4-Hour Work Week”.  I read the book for some ideas on how to improve this blog.  And while it has nothing to do with fantasy baseball, this particular quote does a phenomenal job of illustrating this simple strategy I want to share with you.

We all know fantasy baseball is a competition.  It’s all about gaining an advantage and differentiating yourself from your opponents.

It is impossible to differentiate yourself if you’re following the crowd.  If you’re doing the same things as everyone else, you’ll get the same results.  If you’re fishing in the crowded fishing holes, you’re battling for the same school of fish.

To separate yourself from the pack you have to think differently.  You have to be different.  

If you’re reading the same fantasy baseball advice and commentary as the rest of the competition, you’ll be battling for the same players, you’ll be employing the same strategies, and winning might just come down to luck, timing, or random variations.  I hate luck!

OK.  How Do I Apply This?

The easiest way to execute this strategy is to be a contrarian.  To zag when everyone else is zigging.  To fish where no one else is fishing.  

Think to yourself about what everyone else is doing and what you can do to be and think differently.

You can implement this thinking on two levels:

  1. Behavior and preparation
  2. Player valuation

Let’s take a look.

1.  Behavior and Preparation

This is the part of the strategy to focus on during the off-season.  It is all about out working, out smarting, and “out learning” your opponents.  Do things they’re not.  Zag.

Read (shameless plug – I’ll give you two free e-books).  Get strategies and suggestions from respected experts.  Listen to podcasts.  Don’t just show up to the draft with a token cheat sheet.  Create your own rankings.

You might not be able to do all of these things.  Not all at once and not all in one off-season.  I’m sure you have a life outside of playing fake baseball games.

But if you can study up on two or three new statistics each off-season, you are developing skills and building knowledge that will help you long-term.  Think about the knowledge you can accumulate after three, five, or ten years.  Think about the competitive advantage you can create for yourself.

Most guys won’t be doing this.  They’ll be doing mock drafts, perusing a draft guide, and reading a few sleeper articles.  The same thing year-after-year.  You can take advantage of this.

I’m a firm believer that to be the best at this game you have to make your own decisions.  Only you can be the best manager of your fantasy team.  No expert can make educated decisions for your team.  By reading and studying strategy, you are building skills that will push you in that direction.

You’re off to a good start by reading this blog.  I’m not here to make decisions for your team.  Or to tell you who to pickup or trade for.  I’m here to share important resources you can use and help you develop the skills to give you a competitive advantage.

But how can you zag when it comes to specific player-related decisions?

2.  Player Valuation

This part of the strategy that applies most in-season.  And despite what you might think, it has little to do with Sabermetrics.  You don’t need great skill in Excel.  It has very little to do with data and player analysis.  This is more an exercise in economics than it is baseball statistics.

More specifically, recognizing the optimal time to buy or sell players AND acting during those times.   “Arbitrage” is another word for this, as Jonah Keri discusses in his book “The Extra 2 Percent”.

Everyone Knows Buy Low, Sell High.  You’re Not Telling Me Anything New.

I agree everyone knows this.  But all that “buy low, sell high” advice is in terms of player performance.

To take this strategy to the next level Continue reading “Be A Contrarian… Zag”

Case Study – Weighted Average Probabilities and Ryan Braun

Hindsight is 20-20.  We all know this.  And now that Ryan Braun has been suspended for his association in the Biogenesis scandal, it’s easy to to say that we overvalued Braun in our draft preparation.  But let’s look back to what we knew in the preseason and use this as a learning opportunity to apply a lesson in weighted average probability and expected results.

What Did We Know?

News surfaced in early 2013 that Ryan Braun and numerous other players were associated with Biogenesis.  Documents were obtained that showed an official link between the players and the clinic.   There was speculation that the players involved could face suspensions during the season.

We didn’t know much more than this.  Would players miss 50 games?  100 games? Would the suspensions come down during the 2013 season?  Or after?  Could MLB even uncover enough evidence to support suspensions?

What Could Happen?

For Braun, we could reasonably assume he’d be the target of a 100-game suspension. He was nearly the recipient of a 50-game suspension in the fall of 2012, but managed to avoid it on a technicality.  So new evidence could push him from a first-time offender to a second-time offender (and a 100-game penalty).

Let’s Start A Basic Projection For Braun’s 2013 Season

If we are to build a projection for Braun’s 2013 season, a reasonable place to start would be to look at career averages.  Braun played a partial season in 2007 and played at least 150 games in 2008-2012.  So let’s use these last five years of “full seasons” and figure out the average production as our baseline estimate:

WAP1

These average to 154 games, 672 plate appearances, 34 home runs, 105 runs, 109 RBI, and 22 SB.

But What If This Isn’t An Average Season?

We know Braun was nearly caught as a PED user in 2012. So what if he was scared into stopping his use of PEDs?  Can we build this into our estimate?

We don’t have any scientific data to understand the exact effect of PEDs.  So let’s throw out a rough guess and say we think the effect of stopping the use of PEDs would slightly decrease his production.  We’ll say his numbers would remain at 154 games and 672 plate appearances, but he drops to 25 HR, 90 R, 90 RBI, and 20 SB.

To summarize our two scenarios:

WAP2

How Likely Are These Scenarios To Occur?

You might have your own beliefs about the likelihood of each, but for the sake of example let’s say we think Braun is 90% likely to have another year in line with his past five seasons and 10% likely to experience a year where the effect of no PEDs drags his performance down some.

WAP3

And What If He Gets Suspended?

Again, for the sake of illustrating a simple example, assume a 50% chance Braun does not get suspended during the year and a 50% chance Braun misses half the season.

These 50-50 alternatives are subsets of our previous two scenarios.  So the 90% chance Braun has another average year now becomes a 45% chance (90% * 50%) he has a career average year and does not get suspended and a 45% chance he has a career average year and does get suspended.

Likewise, the 10% chance he sees a drop in productivity due to coming off PEDs is split into a 5% bucket of not being suspended and a 5% bucket of being suspended.

Regardless of the scenarios we lay out, we must remain at 100% total probability for all the possible outcomes.  Something has to happen.  And with 45, 45, 5, and 5, we’re still at 100%.

WAP4

Weighted Average Probability, Expected Results

Once you have probabilities for each possible outcome, it’s easy to calculate the total expected result.  We simply multiply the expected statistics for each scenario by the likelihood of that scenario.  This is the “weighting”.

Look at the 5 Year Avg – No Suspension example.  We have determined this scenario has a 45% chance of occurring.  45% multiplied by 672 plate appearances is 302.40.  45% multiplied by 34 home runs is 15.3.  And so on.

Here are the weighted averages of all scenarios:

WAP5

Our overall or actual expectation is the sum of each different weighted scenario.  You can see this total at the bottom of the table above.  After taking all possible scenarios and their probabilities into account, we estimated Braun for 25 HR, 78 R, 80 RBI, and 16 SB.

The Bigger Point

This approach of calculating weighted average probabilities can be used in many different scenarios.  Do you think there’s a 25% chance Troy Tulowitzki plays a full season, a 50% chance he plays 120 games, and a 25% chance he plays 80 games?  Do you think a rookie has a 25% chance of being called up in May, 25% in June, and 50% in July?  Do you think there’s a 50% chance a player will bat leadoff during the year and a 50% chance he’ll bat 9th?  Is there a 25% chance a rookie call-up will break onto the scene and be very productive, a 50% chance he’ll be an average player, and a 25% chance he’ll be sent back to the minors?

In any of these situations, calculate an estimated outcome and weight it using the probability of that outcome occurring.

Be Smart

Thanks for reading and continue to make smart choices.

Fun With URLs and Player IDs

Here’s a quick tip that can save you a lot of time if you maintain a spreadsheet of player projections, a list of player rankings, or if you’re simply looking for a more efficient way to do player research.

Hypothetical

URL4Let’s say you have a list of ten free agent pitchers you want to look up at BrooksBaseball.net.  You have a preference for pitchers that limit fly balls (thus limiting home runs), have a variety of pitches at their disposal, and you also want to see if they have an effective strikeout pitch(es).  You also want to view the mix of pitches used by the pitcher over time.  Finally, you wish to limit your research to the last two years of major league data (2012 and 2013 seasons, at the time of this article).

You visit BrooksBaseball.net and this example page below (for Clayton Kershaw) displays fly ball percentage, ground ball percentage, the number of pitches and times each has been thrown, and the whiff percentage for each pitch type over the last two years.

URL1

This example page shows you mix of pitches used, by month, over the last two years.

URL2

Between these two pages, we can do all the necessary research to make a decision about the free agent pitchers.

Looks At the URLs For Those Sites

The key to making this player research a more efficient process is to take advantage of the web address (URL) for these pages.  You can locate the web address for a web page by visiting the site and looking at the path shown at the top of your browser.

URL3

The image above is the URL for Kershaw’s “Tabular Data>Sabermetric Outcomes” page at BrooksBaseball.net.  The tail end of that URL has very important information embedded in it that we can use.

www.brooksbaseball.net/tabs.php?player=477132 &gFilt=&time=month&minmax=ci&var=so&s_type=2& endDate=08/04/2013&startDate=03/30/2012

The “player=477132” component of the URL specifies that this search/web page is for player ID 477132, or Clayton Kershaw.

The “endDate=08/04/2013&startDate=03/30/2012” component restricts the search to 2012 and 2013 season data (up to August 4, 2013, the time of writing).

Here’s the typed URL for the “Usage and Outcomes” page at BrooksBaseball.net:

www.brooksbaseball.net/outcome.php?player=477132 &gFilt=&time=month&startDate=03/30/2012&endDate=08/04/2013&s_type=2

The same concepts for player ID and dates apply.  We can now focus in on the bold red text which differentiates the actual type of page being visited.

A Quick Discussion On Player IDs

If you’re not familiar, there are a number of Player ID systems used to track the statistics of major league baseball players.  MLB.com, Fangraphs, and Baseball Reference all have their own player ID system.

Clayton Kershaw’s player IDs for these three systems are as follows:

ID System Player ID
MLB.com 477132
Fangraphs 2036
Baseball Reference kershcl01

Notice that the MLB.com ID for Kershaw is the same as the ID used at BrooksBaseball.net.  So we know that Brooks Baseball uses MLB.com Player IDs.

If you want to know more about Player IDs, look back to part two of the “Create Your Own Fantasy Baseball Rankings” series where we looked at Player IDs, what they are, and how to use them to your advantage when working with large sets of baseball data. Continue reading “Fun With URLs and Player IDs”

Reader Question: I Only Have Several Hours A Week To Devote, What Resources Should I Use?

I recently received a great question from one of the SFBB readers.  So great, that I thought I’d answer in the form of a blog post:

We hit the waiver wire only once a week in our league.  You certainly have given me great tools, but if you have my three or four hours a week to devote, with what and who do you suggest I spend this time? For instance since reading your thoughts, I really believe Olney is a must read.

~ Eddie

This seemingly simple question became complicated for me to answer.  I wasn’t sure if Eddie just wanted to know who my most trusted resources are.  Or if he wanted an outline of a specific process and prioritization I would use to fill three hours a week.

So I’ll take a stab at both.  If you’re looking for my list of most trusted fantasy baseball resources, skip down to the bottom of this post.  If you’re curious about the specific process I would employ to get the most “bang for your buck” by making the most of those three hours each week, keep moving along.

A lot of the thoughts below are just common sense.  This is certainly not the most technical article I’ve ever written.  But hopefully breaking down the process will make us all think more critically about how we conduct player research and how we could more efficiently use our time.

Eye Opening

I didn’t have an immediate answer to Eddie’s question.  At first I laughed, thinking to myself that Eddie only has a few precious hours each week and here I sit posting 20 minute videos and 1,000 word blog posts, sucking up his valuable time.  My next realization was that I don’t even have my own formal system of prioritization in place.  I fly by the seat of my pants, but that’s certainly not “smart”.  Maybe it’s time to think about one.

To design an effective process one must understand the exact problem.  If I had to simplify the fantasy baseball problems I’m trying to address, I would summarize them as “Understanding My Team”, “Identifying Talent”, and “Learning”.

UnderStanding My Team

Before I can reap any benefit from an expert’s advice, I’ve got to have a strong understanding of my team and its place in the standings.  This means:

  1. Assessing my team’s weaknesses and strengths (by roto category)
  2. Assessing my team’s position in the standings and those teams around me
  3. Determining players that are expendable, that I can consider dropping

Items one and two above don’t need to be done every week.  They’re not really time consuming chores, but they must be done to give context to your player research.  I can quickly filter through expert recommendations of sneaky stolen base specialists if I already lead that category.

I probably give a thorough look over the league standings once every two weeks or so.  The standings don’t change rapidly at this point in the season, and it’s going to take time to chisel away at a 20 RBI deficit.  So every couple of weeks I’ll give a good look over my situation and identify areas for improvement.  Then that analysis sticks with me for the next several weeks and becomes the focus of any transactions I’ll make and the player research I’ll conduct.

Item three can’t be done in isolation.  I need to have potential free agents in mind in order to conclude on who is expendable, but I always like to have an idea of who my most expendable player is.  Whether it’s the least talented player on my roster or someone that is talented but simply doesn’t fit current needs, it always helps to know who’s droppable.

Identifying Talent / Player Research

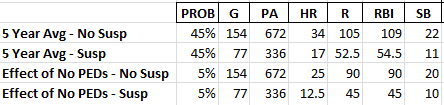
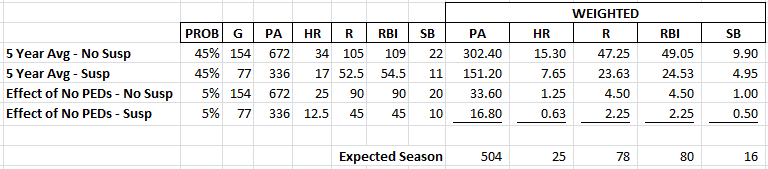
The exercise above of understanding your situation and knowing the approximate value of the player I can drop will allow me to more efficiently conduct player research (and make better use of the few hours I have so I can get back to writing blog posts).   To illustrate, let’s assume I’m looking to gain standings points in home runs and RBI.  After looking over my roster I conclude the player I’m most likely to drop is a struggling corner infielder expected to finish the season with 20 HR and 75 RBI.

With this in mind I can do my own basic research or I begin looking for expert advice on possible pickups.  To do my own research, I start with simple sorting of the free agent list to look for the following:

  • Best overall players available (best preseason rank but struggling)
  • Best categorical players available, year-to-date (which corner infielders have the most HR and RBI)
  • Best categorical players available, last month (which corner infielders have the most HR and RBI in the last month, this might turn up players getting more playing time in the last month than earlier in the season)
  • Which corner infielders are getting at bats over the last two weeks and which of them offer HR and RBI
  • Which corner infielders are most frequently picked up (most major fantasy providers have ways of researching the hottest pickups)

With those results in mind, I can turn to the “experts”.  I can pull up the SFBB Fantasy Baseball Expert Twitter List and scroll through the many “Weekly Pickup” columns that will surely be available.  But now that I’m armed with a sense of my team, the league, and the free agents available, I’ll be able to quickly hone in on the advice and player names that make sense for my team.  If an article clearly misses the mark of addressing my needs or is not consistent with the free agents available in my league, I can move along to the next piece.

I don’t have any “appointment reading” where I visit specific websites daily or weekly.  I let Twitter accumulate the listings of fantasy baseball advice and I’ll scroll through the feed looking for articles that pique my interest.  Similarly, podcasts are a favorite medium of mine, because I too have limited time to devote to research.  But podcasts let me make productive use of time in the car or when I’m going for a jog.

Learning

One of my main goals is to learn along the way and gain exposure to new ideas, new strategies, and new lines of thinking.  The benefit here is twofold.  First, the more I learn, the more likely I am to win and be competitive.  Second, learning is a way for me to garner enjoyment from fake baseball even if I’m not winning.

Allocating Time Between the Categories

The allocation between these three categories will fluctuate throughout the season.  If you haven’t done a thorough review of your team and the league standings in a few weeks, you’ve got to allocate time to this exercise.  I haven’t analyzed this, but I think it’s a safe bet that player research early in the season is more important than later in the season because acquisitions have the opportunity to affect your team for longer and accumulate more stats.  It’s also the time when we know the least about playing time and batting orders.  As the season progresses, if you happen to find yourself out of the running, more time can be devoted to learning about new ideas and new strategies to employ, or for expanding the horizon of your player research (looking more long-term if you’re in keeper/dynasty leagues).

My Most Trusted Fantasy BaseBall Resources

These are my personal favorites.  This is not to suggest there aren’t loads of other great, or maybe even superior, analysts out there.  But based upon their analytic mindsets, their ability to work strategy into their discussions, their insight, and my personal experience with them (they nailed a couple of players that really helped me out), these are the individuals I have grown to trust the most.  I also find many of them funny and pleasant.  I’m not a big fan of brash over-confident fantasy guy.  And they’re out there.

I’m certain you won’t enjoy all of these folks.  Or they just won’t “click” with you.  But maybe there are one or two here that you will connect with.

Name Twitter ID Description
Todd Zola Zola regularly states he would rather teach you something than manage your team for you. That’s a rarity.  I love his stuff.
Jason Collette
Paul Sporer

I group these two together because while a lot of their fantasy work is done independent of each other, I mostly consume their advice via the Baseball Prospectus “Towers of Power Fantasy Hour” podcast these two do weekly.  It’s my favorite fantasy baseball podcast.
Tristan Cockroft A lot of the content on ESPN is targeted for the masses.  Advanced statistics, tables, and deep analysis scare the masses.  But Tristan puts a lot of deep analysis and number crunching into his work.
Buster Olney He’s not a fantasy writer.  But I really enjoy his work and it’s important to think about regular baseball at times and not just focus on fake baseball.  He is on top of everything that happens in the game.  And a lot of what happens has a fantasy impact but won’t necessarily be written about by the fantasy community.
Stephania Bell ESPN’s injury expert.  I don’t track her success rate, but it seems high. If she’s worried about a player, despite the positive news from the team or player, she’s usually right.  If I have an injured player or I’m considering acquiring one, I want to know her thoughts.
Corey Schwartz Corey is a cohost of the MLB.com Fantasy 411’s podcast.  He works a lot of great strategy talk into the podcast.
Eric Karabell Karabell has an analytical approach to the game and a very conservative approach to his play/advice (give me the solid aging veteran over the sexy rookie hype machine).  I like his work.
Mike Podhorzer Mike hosts Fangraphs’ podcast “The Sleeper and The Bust” and is very active elsewhere in the fantasy baseball world.  He uses a lot of advanced statistics and other metrics, like batted ball distance, to identify potential value.
Ron Shandler He’s one of the legends of the industry.  Perhaps the father of the analytical approach to this game.  He doesn’t do much player analysis, but when he speaks, it’s worth listening to.

Do Share

Who are your most trusted resources?  Do you have a formal strategy of how to manage your time?  I had never formally thought about it, but I guess there’s some semblance of thought in my practices.

Thanks.  Make smart choices.

Use PITCH f/x Data To Identify Potential Breakout Pitchers (Part III)

If you’ve made it to Part III in the search to identify potential breakout pitchers, congratulations.  If you missed them, you can find Part I here and Part II here.

Enough Talk, Where Is This List Of Potential Breakout Pitchers?

I’ve uploaded an Excel file to Microsoft Sky Drive.  You can edit, view, or download the file for your own uses.  It’s mostly the same data from the YouTube video, but I added a lot of bells and whistles.  A red cell indicates a pitch that has declined in use from 2012 to 2013.  A green cell indicates a pitch with more usage.  The color intensity indicates the magnitude of the change.  The links to the right take you directly to that specific player’s page on BrooksBaseball.net.

PitchClass14
Click on the image to be taken to the editable file (you can edit or download for your own use).

Disclaimer #1

Keep in mind, I started this analysis on June 24th, 2013.  So if you’re finding this information after that time, you may want to double-check the usage graphs for any pitcher you’re researching.  But I’ve tried to document the approach to doing this research in the video and other parts of this series.  You can perform this research at any time (it would be great if we could get monthly usage reports from Fangraphs, then we could do this in the offseason to identify pitchers who started to change their mix late in the season).

Disclaimer #2

You saw from Part II of this series that these changes in mix have to be taken with a grain of salt.  And even after you’ve verified that there is indeed a change in pitch mix, you still need to go review the effectiveness of the pitches being used more frequently.  I wish I could go through each of these pitchers and break them down for you.  But it’s just not practical (my two-year old and four-year old don’t find PITCH f/x research very entertaining).  Hopefully I’ve equipped you with the tools you need to go analyze these pitchers more closely.

For pitchers on your team, check them out.  If you’re thinking of picking up a free agent, check him out.  If your pitching staff is terrible and you need to find the next big ace, check them all out.

Conclusion

Granted, it’s a small sample size.  But I’ve done a deep look in this fashion for Edward Mujica, Max Scherzer, and Alexi Ogando.  And all show promising results.  There will certainly be pitchers that change their mix and it has little effect on their end results.  But this seems like a promising exercise.

PLEASE LET ME KNOW WHAT YOU THINK Or If You Have Questions

I realize this is quite involved.  It’s certainly more difficult than reading the weekly pickups columns that are out there.  But anyone can read those and snag players just as easily as you can.  This process will put you ahead of the curve, give you players to monitor, and give you first crack at picking them up.

Thanks and be smart.


Use PITCH f/x Data To Identify Potential Breakout Pitchers (Part II)

Picking up where we left off in the post “Use PITCH f/x Data to Identify Potential Breakout Pitchers“, now that we’ve identified the potential pitchers (link to pitchers with differences) who have added a new pitch or that have significantly adjusted their pitch usage mix in 2013, we need to determine if the new or more heavily used pitch is successful.

Before We Go Any Further

I think it’s important you read the article The Internet Cried A Little When You Wrote That On It, by Mike Fast (follow Mike on Twitter).  The whole article will be helpful if you’re trying to improve you understanding of PITCH f/x, but at least read bullet #1.

My takeaway from that piece is that significant changes in pitch mix, especially within the fastball classifications (FA, FT, FC, FS, SI), are most likely to be changes in the algorithm used to classify the pitch.

Take for instance, Jake Peavy.  The PITCH f/x data I downloaded from Fangraphs and manipulated to identify “potentially” new pitches, shows the following for Peavy:

PitchClass2

Interpreting that chart, from 2012 to 2013, the Fangraphs data shows a decrease in the fastball (FA) of 19.9% and increase in the two-seam fastball (FT) of 26.7%.  That sounds interesting on the surface, no?  Decrease one pitch 20% and increase another?

From Mike Fast’s article we know that we can’t necessarily trust the pitch classifications.  So let’s look at the 2012 velocity and spin on Peavy’s pitches:

PitchClass4
Click image to be taken to this page at BrooksBaseball.net

And the same for 2013:

PitchClass3
Click image to be taken to this page at BrooksBaseball.net

From these two charts you can see Peavy’s throwing the same pitches in 2013 that he was throwing in 2012.  The clusters are in the same general vicinity on the chart.  But more importantly, you can see there is very little difference between the fourseam (FA) and the sinker (BrooksBaseball calls the two-seam fastball a sinker (FT)).     So a 20% transfer from one classification to another is likely a change in the algorithm, as we were warned.

Give Me Someone Else to Look At

Alright, Alexi Ogando, although injured recently, has been intriguing.  The raw data shows a sharp decline in fastball usage and an increase in the changeup.  This probably isn’t just a case of an algorithm change (fastballs wouldn’t likely be misclassified as changeups).

PitchClass10

Let’s look at his 2012: Continue reading “Use PITCH f/x Data To Identify Potential Breakout Pitchers (Part II)”

Video: Use PITCH f/x Data To Identify Potential Breakout Pitchers (Part I)

I’ve talked before about the amazing tool we have at our fingertips in PITCH f/x.  I’ve also had two (Scherzer and Mujica) instances this season where I came across seemingly small anecdotes about a specific pitcher adding a new pitch, and the pitcher in question has gone on to have a “breakout” season thus far.  So I thought to myself…

Why Not Look For More Pitchers Who’ve Added A New Pitch

And rather than just share the results with you, I thought it might be more beneficial to share the method I used to do my search.  You know, the whole “teach a man to fish” proverb.

While there is a lot of great PITCH f/x data available at sites like Fangraphs and BrooksBaseball.net, I have not been able to locate a resource that allows me to do a year-to-year comparison of the data across a large pool of players (BrooksBaseball can show you great comparisons for a specific player).  So to identify these pitchers who have developed a new pitch, I had to download sets of data for 2012 and 2013 and apply some functions in Microsoft Excel.

I recognize that some of my posts get a bit lengthy and this process may have pushed the limits, so I’m trying something new and have put together my first YouTube video (if you’re interested in being notified of future videos, click here to subscribe to the SFBB YouTube channel).

About The Video

The video is approximately 15 minutes long, and takes you through a step-by-step process to download PITCH f/x pitch usage data from Fangraphs.com, pull the data into Excel, match up 2012 and 2013 pitch usages, calculate a difference in pitch usage, use the calculated difference to target players that are most likely throwing a new pitch in 2013, and how to use BrooksBaseball.net to conduct further research on individual pitchers.

Coming Soon

I’ll polish up the results and post an Excel file, containing pitchers to keep an eye on, for you to analyze.

Thanks for reading… and watching.  Stay smart.