New Excel Tool – SGP Slope Calculator

I can’t believe it took me so long to think of this! In this post I’ll share a new Excel template I created to help calculate your SGP factors (or SGP denominators).

One of the very first posts I wrote on this site was about “Calculating What it Takes to Win Your League”. I’ve then gone on to write many articles about standings gain points and even about an improvement in the process I found by reading Art McGee’s book “How to Value Players for Rotisserie Baseball” (It’s quite expensive at Amazon but Baseball HQ has had it on “Inventory Closeout” for quite a long time).

So after a few years of writing about SGP it finally dawned on me that, “I should create an Excel file that wraps all this together.” So that’s what I’ve tried to do. The “SGP Calculator” asks a few simple setup questions about your league, the amount of history you want to use, and then uses the SLOPE formula to calculate the standings gain points for each of your league’s scoring categories.

Here’s How the “SGP Calculator” Works

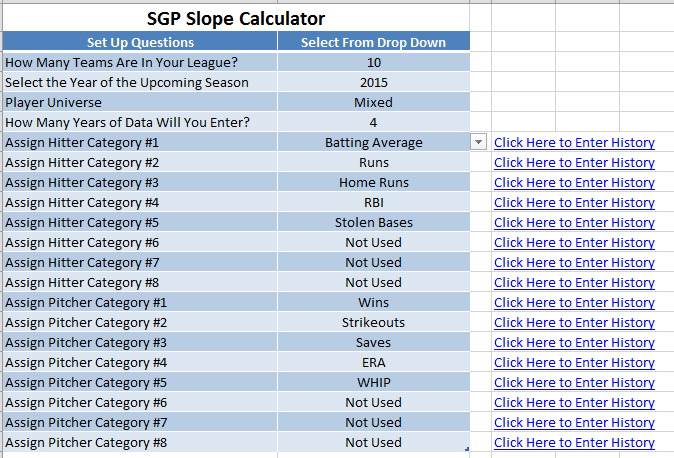
The first tab is aptly named “ANSWER THESE QUESTIONS FIRST”. Several of these are very important in determining how the slope calculations are made so don’t skip over this.SGP_SLOPE_SETUP_QUESTIONS

The Excel file can accommodate up to eight different hitting and pitching categories, up to 10 years of standings information, and up to 15 teams. Use the drop down menus on this tab to select your league’s setting.

The next tab in the spreadsheet is “SGP CALCULATIONS”. Let’s skip over that for now and circle back to it.

SGP_CALCULATIONS

The yellow colored tabs are where you will enter your league history of the overall standings and the totals in each individual category. There are tabs for “Historical Final Standings” (where you’ll enter the total ending roto points for each team), “Hitter Stats”, and “Pitcher Stats”.

There are 17 yellow tabs.  One for overall standings and then eight each for hitting and pitching categories.
There are 17 yellow tabs. One for overall standings and then eight each for hitting and pitching categories.

Each yellow tab displays the “Category Name” in the top left (see “Batting Average” example below). You can enter the history for that category in the table below. Because the spreadsheet has been set up to accommodate 15 teams and 10 years of history you may see several rows and columns with labels “DO NOT ENTER DATA”. Just ignore those rows and columns and only enter data for the years and number of teams you have selected.

The image is large but I had to shrink it to fit here.  Click the image to see the full version.
The image is large but I had to shrink it to fit here. Click the image to see the full version.

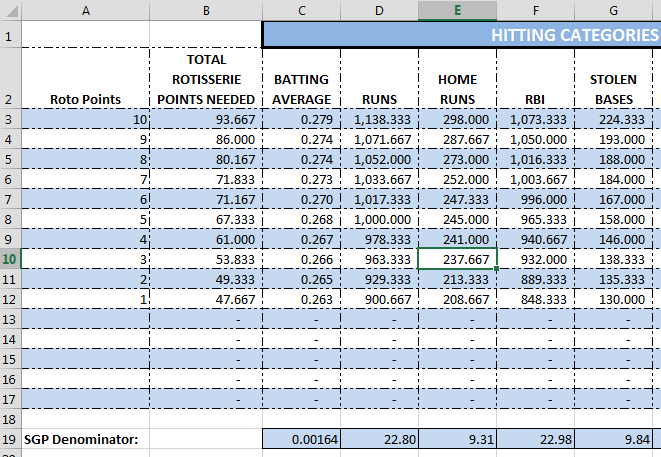
Now we can return to the “SGP CALCULATIONS” tab, the end result. It displays the average statistics for each scoring category and uses Excel’s SLOPE formula to calculate the SGP factor (denominator) for each category.

Click the image to see the full-sized version.

These are the same SGP factors you would then plug into your customized rankings.

Download the File

Continue reading “New Excel Tool – SGP Slope Calculator”

How To Calculate Projected Standings For Your Draft

So you’ve got a great set of projections, rankings, and dollar values.

This is great for draft preparation. But how do you take this information and use it during the draft?  Is there a way to monitor the progress of the draft and see if you’re lacking in power compared to the others in the league?  Do you need speed?  Are you lacking in strikeouts?

You don’t need to buy draft software or a special draft spreadsheet.  You can easily add a few more things to your Excel files and have a very powerful draft tool that can help you make these assessments.

I wrote about how to track drafted players in a spreadsheet last January.  If you haven’t read that yet, please do.  The instructions that follow pick up where that post leaves off.

Here’s how to calculate projected standings during your draft.

Prerequisites

I’ll be using Excel 2013 to create the projected standings.  I think you’ll be able to follow a very similar process in Excel 2010 and Excel 2007.

Teams_DraftedAs I mentioned, this post assumes you have already added the named range and data validation drop down listing to select the team that has drafted a player.

This is how you will be tracking the draft selections during your draft.  As each player is taken, you’ll locate them on your rankings/projections lists and select the team that drafted them.

I realize it’s a little early to be thinking about draft spreadsheets, but it’s top of mind for me now because I am participating in a mock draft that was coordinated by Bryan Curley of BaseballProf.com.  I wanted to see how the draft is going and how teams stack up after the first few rounds.  Not to mention you can set this up in your spreadsheet now and have it read to roll when we finally get closer to the season.

You can see the list of those participating in the mock draft in image above.  As selections are being made in the draft, I’m marking them off in drop down I created in the “TAKEN” column.TAKEN
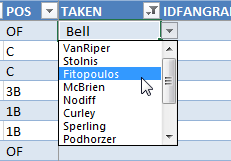
 

You may want to make several “fake” selections in your Excel file, just to have some data to work with.  You will want to test that your projected standings are working prior to the draft…  That’s the last thing you need to be monkeying on draft night.

Excel Functions and Features We’ll Be Using

There are a variety of ways to do this, but I’ll show you how to use a pivot table in this example.  If you’ve never created a pivot table before, don’t worry.  They’re a lot easier to work with than most think.

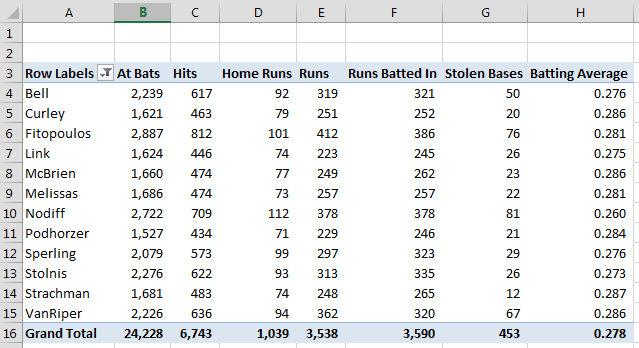
The pivot table will help us to quickly accumulate every team’s offensive stats (R, RBI, HR, SB, BA).  Once we have the statistics accumulated in one nice table, we’ll then use the RANK formula to calculate the standings.

Pivot Tables

Pivot tables are very useful for taking a lot of lines of data (like we have on our “Hitter Ranks” tab) and combining or summarizing that data into more easily or digestible parts.

For example, your listing of all hitters and their projections is probably hundreds of rows of information.  If you were to select 14 hitters for each of the 12-teams in your league, that would be 168 hitters.  Sorting all of those players into teams and then calculating the totals for five different categories for each team might seem like a daunting task.

The good news is that creating a pivot table can be done in only a few clicks of the mouse and within minutes you can have a table that looks just like this:
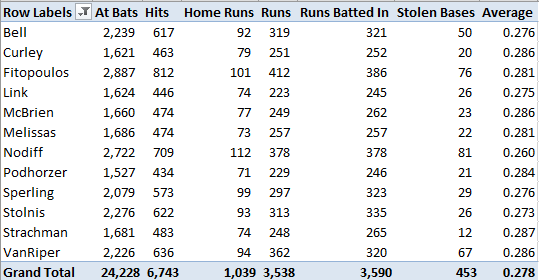
Pivot_Table_Projected_Standings

Rank (or RANK.EQ) Formula

These two formulas are essentially the same; however, RANK was discontinued in Excel 2010 and was replaced by RANK.EQ.

If you’re using Excel 2010 or later, either one should work. But if you are using Excel 2007 or earlier, you must use RANK (RANK.EQ didn’t exist then).

These formulas will interpret a list of numbers and return the ranking of a specified item in the list.  We can use this to analyze the entire list of player SGPs and give us a ranking for each player (e.g. Mike Trout is #1).

The formulas require three inputs:

RANK(Number, Ref, Order)

RANK.EQ(Number, Ref, Order)

  1. Number – This is the specific number you want ranked. If your goal is to figure out where your team ranks in total home runs, you would select the individual cell containing your team’s projected home runs.
  2. Ref – This is the range of data, or the list of data, to calculate the ranking from. Continuing with the total home runs example, you would select the entire listing (or range) of projected home runs for all teams in the league.
  3. Order – Technically this is not a required part of the formula, but using it can make our lives a little easier. If you leave this part out of the formula, Excel would return a “1” for the team with the most home runs and a “12” for the team with the least home runs. You can see we don’t really want to know our “Rank”. We’re looking for “Rotisserie Points”. We would like the top team in home runs to show a “12”. The “Order” parameter in the RANK function is looking for a zero or a one. If you leave it blank or put in a zero, the RANK function gives a “descending” ranking. This is the typical ranking where “#1” is the best or highest possible ranking. We are looking for an “ascending” ranking, where a “12” is the best result. To do this, just put a one in for this piece of the function.

Step-by-Step Instructions

Continue reading “How To Calculate Projected Standings For Your Draft”
The Difficulty In Aggregating Projections

Now that we’ve established that we can benefit from combining multiple projection models into one, let’s take a look at the challenges this presents.

I’ll also give brief explanations of how you can work around these challenges in Excel.  At the end I’ll discuss an Excel template I’m working on that will do these calculations for you automatically and how you can get your hands on it.

I love Your Feedback

If you’re a SFBB Insider you might recall that after you sign up, the very first e-mail I send you asks you to reply with any fantasy baseball topics you’d like to know more about or difficulties you’re having (if you’re not, you can register here.  I like to think it’s worth your while).

Insider

I Read All Of Those Responses

I’ve been fortunate enough to have nearly 500 people register, and I read every single response that comes in from that question.  One of the most frequent areas of interest is how to average, or aggregate, multiple sets of projections into one usable set of information.

More Difficult Than I Originally Thought

These requests started to roll in during the off-season, and I even replied to several people saying that I thought this was going to be easy and that I’d have guidance coming out soon on how to do this.

… And here I sit months later having never written on the topic yet.

In theory, averaging a set of three numbers in Excel is easy.  If one system says 25 HR, one says 30 HR, and another says 35 HR, Excel’s AVERAGE formula can easily respond with the average of 30.

But I quickly ran into some big problems that greatly complicated things.

Problem 1 – Lining Projections Up To Do The Averages

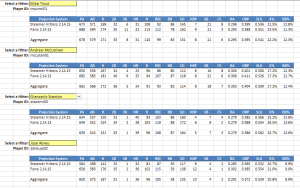
In order to aggregate multiple projection systems into one, we need a method of “lining up” the projections from one system with those of another system.  Perhaps Giancarlo Stanton is projected to hit 20 HR the rest of the season by Steamer and 22 HR by PECOTA.

Giancarlo_Stanton_ROS
I made this information up just to illustrate the concept of “lining up” different projections.

We can use formulas in Excel (e.g. VLOOKUP) to pull Stanton’s Steamer projection and place it next to his PECOTA projection.  But you can run into some complications in doing this.  What if one projection system lists him as “Stanton, Giancarlo” and the other as “Giancarlo Stanton”.

Using names to pull data also opens you up to inconsistencies in the name being used.  Is it Jonathan Singleton or Jon Singleton?  AJ Burnett or A.J. Burnett?

If you have taken on the challenge of creating your own rankings, you know that we’ve dealt with this problem before, but on a smaller scale.  In my rankings spreadsheets I use a consistent playerID to pull information between the different tabs.  I prefer to use the Baseball-Reference playerIDs because you can tell who a player is (Stanton is “stantmi03” because there were two other Mike Stanton’s before him).

But seemingly every major baseball site has their own player ID system.  Fangraphs says Stanton is “4949”, Baseball Prospectus uses “57556”, ESPN says “30583”, etc.

This is why I maintain the SFBB player ID map Excel file.  The map allows for this translation or “lining up” to happen.  It’s the bridge that can easily help you take Stanton’s projection from one system and place it next to his projection from another.  Giancarlo_Stanton_PlayerID

Problem 2 – Players Not Projected In All Systems

Continue reading “The Difficulty In Aggregating Projections”

Tool Review – FantasyBaseballAlerts.com

I’m in four leagues this season.  Only one of which has weekly lineups. So that leaves me with three teams with daily rosters to manage.

I’m also trying to dip my toes into the strategy of platooning hitters to gain a slight edge on the competition, by employing players like Adam Lind and Seth Smith.

The problem with this strategy is that Lind and Smith are out of the lineup a handful of days each week because their Major League teams are also platooning them.

I usually start my day by setting my lineup, putting anyone without a game on the bench and moving starting pitchers into the lineup.  But I don’t really take the time to check if the Blue Jays or Padres are facing a lefty. This leaves me with a problem.  The advantage I could get by running a platoon is more than offset if I don’t even have a guy in the lineup on a given night.

One Solution

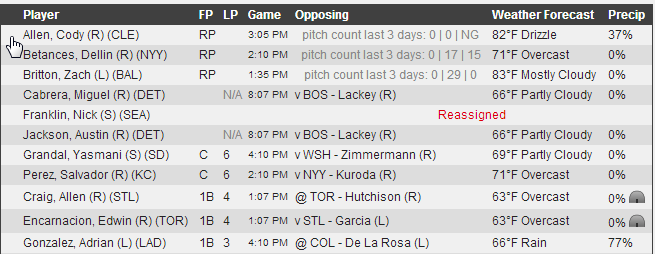
I’ve written previously about the very helpful “My Lineup” tool at BaseballPress.com. As far as I know, they’ve still got the earliest and most accurate lineups available.  They also provide weather information, recent relief pitcher usage information (look at Betances below), and batting lineup info (Allen Craig is batting 4th today). BaseballPressMyLineup That information is second to none.  I love this tool.  But I often leave work at 5:30 PM and don’t get home until 6:30 PM, where I’m greeted by the chaos of my beautiful three and four-year old daughters.  So pulling up Baseball Press before the 7:05 starts is not top of mind.
Another Solution

Right around the time the 2014 season started, I received an e-mail from one of the guys that runs FantasyBaseballAlerts.com.  They wanted to know if I’d be interested in trying out their service (more about that in a minute) for free.

I get a number of requests from sites wanting to run ads here or that want me to put links to their site, and I don’t usually act.  I could probably make a few bucks by running ads, but one of the principles I use in guiding this site is that I’ll only promote or link to services I use, books that I’ve read, or ideas I believe in.

With this in mind, the idea behind FantasyBaseballAlerts.com really seemed beneficial to me.  So I signed up to test it out.

What The Service Does

It’s very similar to BaseballPress, but the information comes to you.  You don’t have to seek it out.

Simply put, you get an e-mail or text message sent to you when a player on your fantasy team is not in the starting lineup for their Major League team that day.

You can also choose to receive either e-mail or text message alerts containing player news, DL information, and more.

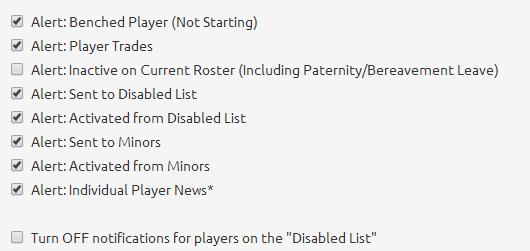
Here’s a full list of the types of alerts you can have sent to you:FantasyBaseballAlerts2

Example E-mails

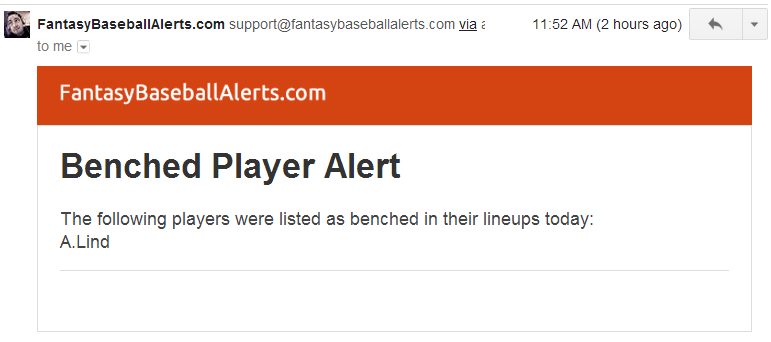
Here’s an example notice about Adam Lind being benched.  Notice that the alert e-mail was sent at 11:52 AM for a 1:07 PM start time.  A pretty solid amount of time to notice the e-mail and make the roster change. FantasyBaseballAlertsAdamLind Continue reading “Tool Review – FantasyBaseballAlerts.com”

In Season Player ID Map Update

I’m preparing to roll out another resource that will hopefully help bring clarity to your in-season moves (I think it’s going to be big!).  In preparation for this, I’ve gone through and done a Player ID Map update to include players that have recently become “fantasy-relevant”, in my mind.

You can download the updated map here.

A complete list of changes can be found in the “Change Log” tab of the spreadsheet.

ESPN_Player_ID

Some of the more notable additions to are:

If you’re new to the site, consider checking out these past posts that illustrate some interesting things you can do with player IDs.

Please let me know if I’ve missed anyone.  Stay smart.

New Tool – Historical Batting Lineups By MLB Team

Where a player hits in the lineup matters.  For every spot a player moves down the order (lead off to second, fifth to sixth, etc.), that player loses approximately 0.1 plate appearances per game, or about 16 plate appearances over the course of the season.

If a player moves from second to third…  not a big change in a player’s value.  But if you were originally projecting a player to bat 9th and he gets bumped up to be the lead off hitter, that could increase a player’s value 15-20% (8 lineup spots * 16 plate appearances = 128 additional PAs)!!!

I Stumbled Upon This Very Helpful Page at BaseBall-Reference.Com

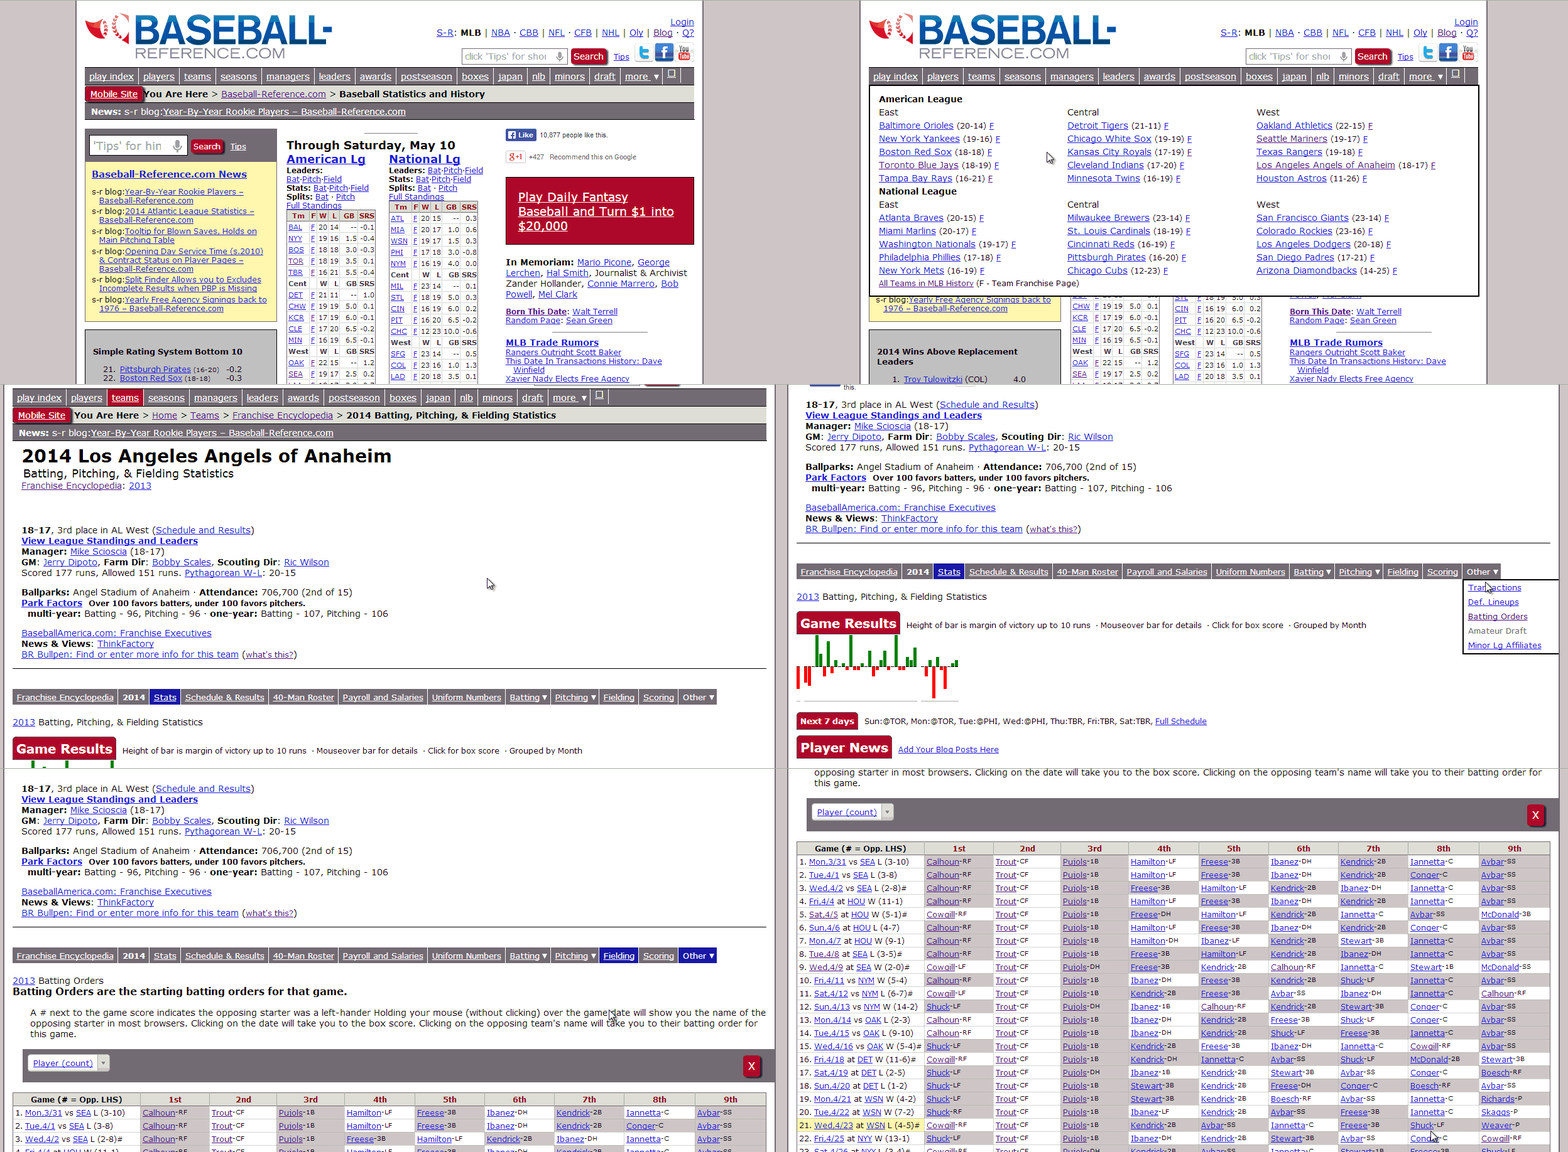
Each team at baseball-reference.com has a batting order page that displays the starting lineup for each game.  Baseball_Reference_Batting_Order

This is a great way to keep an eye on trends in a team’s lineups and to monitor where your players are hitting.  I’ll often try to check this and it usually takes several clicks to drill down into a player’s game log, click on the last few games, scroll down to the box scores, click back a few times to check the next game, etc.

But these team pages will make it much easier to get the information.

baseball-reference-batting-orderA Lot Of Useful Information

Continue reading “New Tool – Historical Batting Lineups By MLB Team”

2014 Player ID Map Update

Draft day has come and gone, but if you’re looking to keep up-to-date with the Player ID Map, I’ve run a significant number of changes through the file.  In addition to adding rookies that should have a fantasy impact this year, a number of edits to player teams were made, many missing IDs were filled in, and Davenport, Baseball Prospectus, and Yahoo IDs were added to the file.

You can download the updated map here.

A complete list of changes can be found in the “Change Log” tab of the spreadsheet.

ESPN_Player_ID

Some of the more notable additions to the Player ID Map are:

  • Masahiro Tanaka
  • Noah Syndergaard
  • Jameson Taillon
  • Archie Bradley
  • Alexander Guerrero
  • Miguel Sano
  • Maikel Franco

If you’re new to the site, consider checking out these past posts that illustrate some interesting things you can do with player IDs.

Please let me know if I’ve missed anyone.  Stay smart.

How To Improve Your Fantasy Baseball Knowledge

Justin Timberlake has come a long way. He started out as a dorky little kid on the Mickey Mouse Club, “progressed” (notice the strategic use of quotation marks) to this, started dating the hottest celebrities (at the time), began appearing in award winning movies, and now he’s winning solo recording artist honors.

This example of Timberlake was mentioned by Marc Ecko, the billion-dollar fashion mogul, in a podcast interview about what it takes to be great (click here to listen). He used this illustration of Timberlake to point out that nobody ever really starts out great. It’s a process. To paraphrase what Ecko said:

The key to greatness is iteration.

According to Wikipedia:

Iteration is the act of repeating a process with the aim of approaching a desired goal, target or result.

Said another way, it’s about making continuous improvement over time. Small improvements. But a lot of them. Not necessarily dramatic leaps forward.

Timberlake didn’t just snap his fingers and go from scrawny Mickey Mouse Club kid to Music-Superstar-Hollywood-Actor-Junk-In-A-Box-Heartthrob. It took him years to get there.

Every season. Small incremental improvements. For many seasons.

If you start applying this concept now and master a couple new fantasy baseball concepts each year, think how good you will be five or even ten years from now.

Are You Improving?

One reason I enjoy having this site is that it holds me accountable to improve at this “craft” of playing fake baseball games.

I have had seasons in the past where I didn’t seek to improve knowledge or understanding of the game. But now I have reached a point where I try something new every year.

I make my draft preparation a little more involved. I add new features to my spreadsheet. I  enhance my rankings formula. I consider other ways of ranking players. I just developed my own projections for the first time. I read books about (real) baseball, Sabermetrics, technology, and even fantasy baseball.

So What Are You Doing To Improve This Year?

There are many things you can do. Here are some things that come to mind Continue reading “How To Improve Your Fantasy Baseball Knowledge”

Player ID Map Updated For 2014

If you’re looking to get a jump start and create your own rankings for the 2014 fantasy baseball season, the SFBB Player ID Map has been updated for those players expected to be “fantasy relevant”.  ESPN’s player IDs have also been added to the spreadsheet.

You can download the updated map here.

A complete list of changes can be found in the “Change Log” tab of the spreadsheet.

ESPN_Player_ID

Some of the more notable additions to the Player ID Map are:

  • Jose Fernandez
  • Sonny Gray
  • Wil Myers
  • Anthony Rendon
  • Bruce Rondon
  • Zack Wheeler
  • Kolten Wong
  • Mike Zunino
  • Michael Wacha
  • Yasiel Puig
  • Xander Bogaerts
  • Brad Miller
  • Danny Farquhar
  • Danny Salazar
  • Taijuan Walker

If you’re new to the site, consider checking out these past posts that illustrate some interesting things you can do with player IDs.

Please let me know if I’ve missed anyone.  Stay smart.


3 Free Alternatives to Microsoft Excel Every Fantasy Baseball Manager Should Know

Microsoft Excel is my go-to spreadsheet application, but what if you don’t have access to Excel?  After all, it’s expensive to purchase ($100+).  Are you out of luck when it comes to being a data-driven fantasy baseball player?

Hardly.  There are several free options available and they’re more comparable to Excel than you might think.

Microsoft One Drive (Online Access to a Free Version of Excel)

You can set up an online Microsoft OneDrive account free of charge.  This gets you access to a free online version of Microsoft Excel that offers most of the capabilities available in the desktop version.  You can see a screenshot of the program below.

ExcelAlt1

It’s definitely a viable spreadsheet application.  It offers nearly all the built in functions (VLOOKUP, SUM, IF, etc.) of the traditional Microsoft Excel.  It can meet the needs of any basic to moderately complex spreadsheet.

But there are several features I like to include in more advanced spreadsheets (like the sheet created in the SmartFantasyBaseball “Create Your Own Fantasy Baseball Rankings” series), that can’t be utilized in this online version of Excel.  Most notably, you cannot create named cells or named ranges.  Additionally, you cannot set up data validation, like drop down menus.  These aren’t deal breakers, you can likely work around the absence of these items.  But they’re definitely nice to have.

I’m also not aware of a way to link one Excel Sky Drive file to the data in another file saved in Sky Drive.  This would be nice if you have one central Excel file that stores a lot of data and you want to be able to access it from multiple files that will rely upon that data.  I don’t typically link documents together in this fashion, but it’s good to know.  Online Excel files do have certain file size limitations that might make linking necessary (and you won’t be able to do it).

Google Drive (Free Online Access to Google’s Spreadsheet application)

If you have a Gmail account or if you register for a free Google account, you get access to Google Drive and free online file storage.  You then get access to use Google’s free online word processor, spreadsheet, and presentation applications.

ExcelAlt2

In my opinion, Google offers a more comprehensive online solution than Microsoft does. I find file management is a lot easier in Google’s interface.  And within a Google Spreadsheet, you can use some of the advanced features not available in the online version of Excel.  For example, you can create named ranges, link to other Google spreadsheets, and even pull in other content on the web.

I’ve created several complicated spreadsheets within Google documents using named ranges, upwards of 100 tabs, and linking to external Google Spreadsheets documents, and I’ve been very happy with the results.

Open Office (Free Suite Of Office-Like Applications)

I do think Google’s online spreadsheet application is a strong alternative, but no online spreadsheet is going to replace the capabilities of a spreadsheet saved, accessed, and run directly from your own computer.

When working on your own computer (as opposed to a spreadsheet running over the web), the functionality is improved, calculations are processed faster, the program is more powerful, and the usability is much better.  Fortunately, we have OpenOffice, which is a free alternative to Microsoft Office’s product line.  OpenOffice has a spreadsheet, word processor, and presentation application, all available free of charge.

Millions of people use the OpenOffice suite and the look and feel of the programs is similar to older Microsoft Office interfaces.  If you’re used to the Ribbon interface used by Microsoft Office products in the last several years, the menu systems may feel antiquated.  But the program gets the job done.

OpenOffice file formats are generally interoperable with Microsoft file formats, meaning you can save OpenOffice documents and spreadsheets into Office file formats for sharing with Office users.

ExcelAlt3

My Recommendation

I enjoy the more robust experience of running a spreadsheet application from the computer, as opposed to one running of the web, but I really like the experience of using Google Drive and the Google spreadsheet application.  If you’ve read some of my longer posts you’ll know that I’m a fan of using named ranges, and that gives Google a big advantage of Microsoft Excel’s online web app.  I also use Gmail and find the Google Drive app for my phone is very easy to use and access data from.

So I think it comes do to your own preferences and if you prefer a traditional program running on your computer or if you like the mobility, access, and backup benefits offered by a web-based application.  OpenOffice is a very strong (and free!) option to run locally.  And Google wins the web app battle, in my mind.

Conclusion

Don’t think you can’t implement the ideas or use the tools from SmartFantasyBaseball just because you don’t have access to Microsoft Excel.  There are high quality and free alternatives available to you.

Be smart.