Fun With URLs and Player IDs

Here’s a quick tip that can save you a lot of time if you maintain a spreadsheet of player projections, a list of player rankings, or if you’re simply looking for a more efficient way to do player research.

Hypothetical

URL4Let’s say you have a list of ten free agent pitchers you want to look up at BrooksBaseball.net.  You have a preference for pitchers that limit fly balls (thus limiting home runs), have a variety of pitches at their disposal, and you also want to see if they have an effective strikeout pitch(es).  You also want to view the mix of pitches used by the pitcher over time.  Finally, you wish to limit your research to the last two years of major league data (2012 and 2013 seasons, at the time of this article).

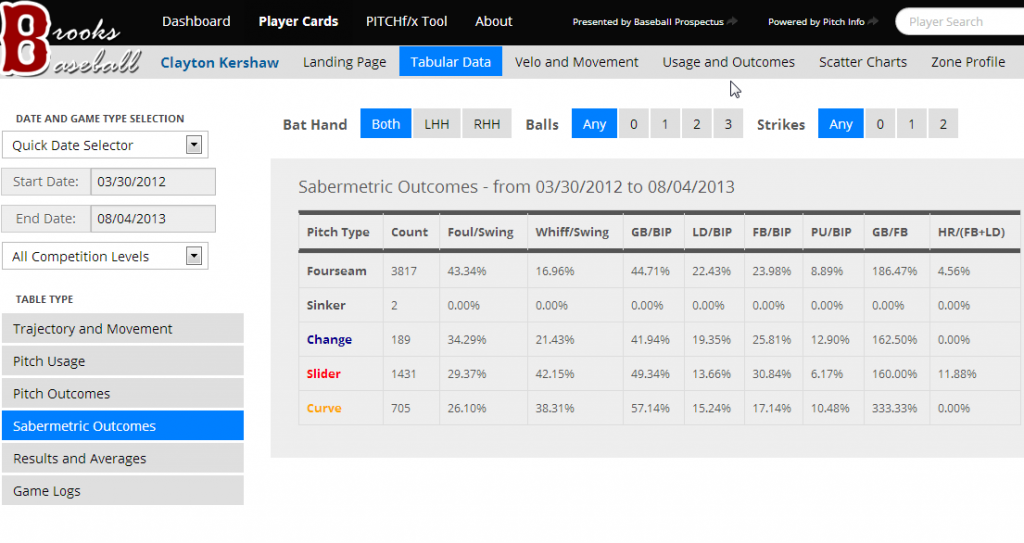
You visit BrooksBaseball.net and this example page below (for Clayton Kershaw) displays fly ball percentage, ground ball percentage, the number of pitches and times each has been thrown, and the whiff percentage for each pitch type over the last two years.

URL1

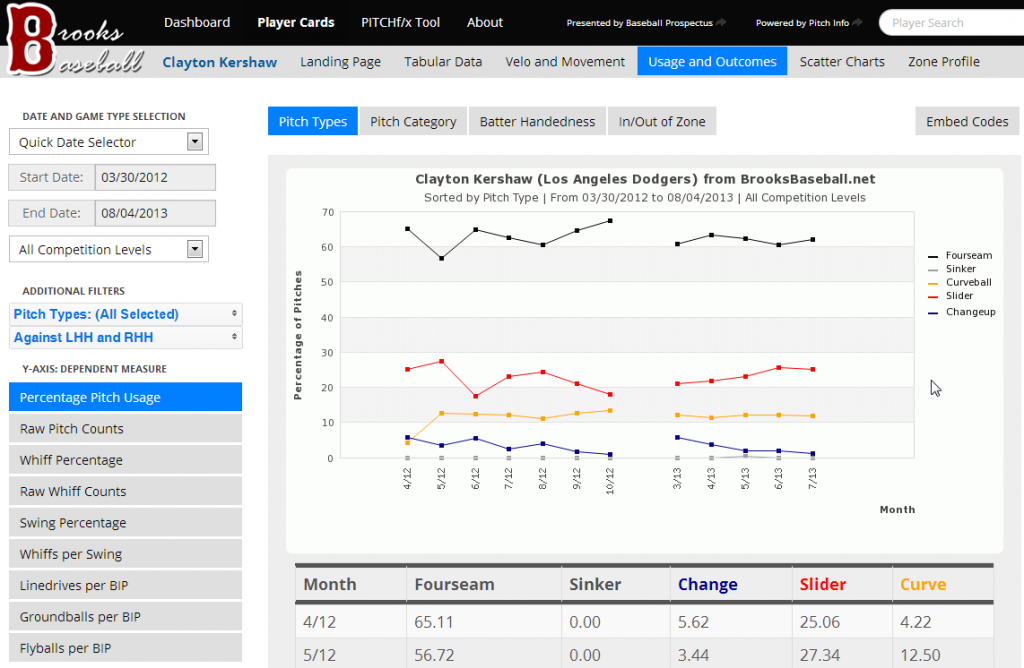
This example page shows you mix of pitches used, by month, over the last two years.

URL2

Between these two pages, we can do all the necessary research to make a decision about the free agent pitchers.

Looks At the URLs For Those Sites

The key to making this player research a more efficient process is to take advantage of the web address (URL) for these pages.  You can locate the web address for a web page by visiting the site and looking at the path shown at the top of your browser.

URL3

The image above is the URL for Kershaw’s “Tabular Data>Sabermetric Outcomes” page at BrooksBaseball.net.  The tail end of that URL has very important information embedded in it that we can use.

www.brooksbaseball.net/tabs.php?player=477132 &gFilt=&time=month&minmax=ci&var=so&s_type=2& endDate=08/04/2013&startDate=03/30/2012

The “player=477132” component of the URL specifies that this search/web page is for player ID 477132, or Clayton Kershaw.

The “endDate=08/04/2013&startDate=03/30/2012” component restricts the search to 2012 and 2013 season data (up to August 4, 2013, the time of writing).

Here’s the typed URL for the “Usage and Outcomes” page at BrooksBaseball.net:

www.brooksbaseball.net/outcome.php?player=477132 &gFilt=&time=month&startDate=03/30/2012&endDate=08/04/2013&s_type=2

The same concepts for player ID and dates apply.  We can now focus in on the bold red text which differentiates the actual type of page being visited.

A Quick Discussion On Player IDs

If you’re not familiar, there are a number of Player ID systems used to track the statistics of major league baseball players.  MLB.com, Fangraphs, and Baseball Reference all have their own player ID system.

Clayton Kershaw’s player IDs for these three systems are as follows:

ID System Player ID
MLB.com 477132
Fangraphs 2036
Baseball Reference kershcl01

Notice that the MLB.com ID for Kershaw is the same as the ID used at BrooksBaseball.net.  So we know that Brooks Baseball uses MLB.com Player IDs.

If you want to know more about Player IDs, look back to part two of the “Create Your Own Fantasy Baseball Rankings” series where we looked at Player IDs, what they are, and how to use them to your advantage when working with large sets of baseball data. Continue reading “Fun With URLs and Player IDs”

Test Yourself – Are You a Stat Chaser?

We’ve all been there.  A player gets hot and hits several home runs in a week or a rookie gets called up and goes 3-for-3 in his first game.  But one of the most dangerous things a fantasy owner can do is “chase” these stats.  When adding players, you don’t get credit for yesterday.

The challenge is to be ahead of the curve.  Pickup the players before the big opportunity comes.  Accumulate the good stats.  Sense when a turn has been made and bail.

The worst thing you can do is continually chase today’s “hot” player, hold him for the next two weeks when he does nothing, and then repeat the cycle.

This is extremely difficult to do.  It’s against human nature.  It makes us feel warm and fuzzy to pick up that hot player.  It’s stressful and fraught with uncertainty to pickup a struggling player that may soon come into opportunity.  How can we fight these urges and determine how well we do at this?

Look Back

Wouldn’t it be great if there were an easy way to look back at every player you’ve owned over the course of the year to see the statistics they earned for your team?  You could see if you’ve owned a bunch of players that performed well below their season averages.  Then you’re likely a “stat chaser”.

Or maybe the majority of players performed in line with the rest of their season statistics and you’re displaying the patience and foresight necessary to succeed at this game.  Regardless, a restrospective review of your players’ performances can indicate if a change is necessary or confirm you’re on the right track.

The Good News Is…

There is an easy way to do this (at least in Yahoo! and CBS leagues).  In Yahoo!, access the “Team Log” link on your page.  In CBS leagues, look up player stats and filter them to show “fantasy” stats, meaning those actually accumulated for your team.

How To View Accumulated Stats In Yahoo!

  1. On your “My Team” page, locate the “Team Log” link.
    retro1
  2. You’ll then be presented with the list of every player you’ve owned over the course of the season and the statistics they’ve accumulated for your team (Forgive the small images.  Click on pictures below to see a full-size image).
    retro2
  3. You want to see players with stat lines consistent to their season averages.  The rate statistics like batting average, ERA, and WHIP are easy to compare.  You’ll have to adjust counting stats for games played, at bats, or innings pitched.   If you stream pitchers or selectively start those on your team, you hope to see an ERA and WHIP below season averages (under the assumption that you’re cherry picking the good matchups).
    retro3
  4. You don’t want to see pitchers with stat lines well worse than season averages.  This indicates one of several things.  You’re either failing at selecting good matchups.  You overreacted to one or two bad starts, accumulating the bad stats and not having the patience to wait for the regression.  Or you’re unlucky.
    retro4
  5. Be on the lookout for stat lines like the one below.  They’re not necessarily problematic if done in the right fashion.  I will often speculate very early on a player that I think will soon come into a favorable situation or opportunity, hoping for a huge payoff.  For this approach, hopefully I’ll also see a handful of “hits” to offset “misses” like this one on Martin.
    retro5


How To View Accumulated Stats in CBS

The process to get these statistics on CBS’ website is a little more convoluted, but it’s not difficult to do. Continue reading “Test Yourself – Are You a Stat Chaser?”

Use PITCH f/x Data To Identify Potential Breakout Pitchers (Part III)

If you’ve made it to Part III in the search to identify potential breakout pitchers, congratulations.  If you missed them, you can find Part I here and Part II here.

Enough Talk, Where Is This List Of Potential Breakout Pitchers?

I’ve uploaded an Excel file to Microsoft Sky Drive.  You can edit, view, or download the file for your own uses.  It’s mostly the same data from the YouTube video, but I added a lot of bells and whistles.  A red cell indicates a pitch that has declined in use from 2012 to 2013.  A green cell indicates a pitch with more usage.  The color intensity indicates the magnitude of the change.  The links to the right take you directly to that specific player’s page on BrooksBaseball.net.

PitchClass14
Click on the image to be taken to the editable file (you can edit or download for your own use).

Disclaimer #1

Keep in mind, I started this analysis on June 24th, 2013.  So if you’re finding this information after that time, you may want to double-check the usage graphs for any pitcher you’re researching.  But I’ve tried to document the approach to doing this research in the video and other parts of this series.  You can perform this research at any time (it would be great if we could get monthly usage reports from Fangraphs, then we could do this in the offseason to identify pitchers who started to change their mix late in the season).

Disclaimer #2

You saw from Part II of this series that these changes in mix have to be taken with a grain of salt.  And even after you’ve verified that there is indeed a change in pitch mix, you still need to go review the effectiveness of the pitches being used more frequently.  I wish I could go through each of these pitchers and break them down for you.  But it’s just not practical (my two-year old and four-year old don’t find PITCH f/x research very entertaining).  Hopefully I’ve equipped you with the tools you need to go analyze these pitchers more closely.

For pitchers on your team, check them out.  If you’re thinking of picking up a free agent, check him out.  If your pitching staff is terrible and you need to find the next big ace, check them all out.

Conclusion

Granted, it’s a small sample size.  But I’ve done a deep look in this fashion for Edward Mujica, Max Scherzer, and Alexi Ogando.  And all show promising results.  There will certainly be pitchers that change their mix and it has little effect on their end results.  But this seems like a promising exercise.

PLEASE LET ME KNOW WHAT YOU THINK Or If You Have Questions

I realize this is quite involved.  It’s certainly more difficult than reading the weekly pickups columns that are out there.  But anyone can read those and snag players just as easily as you can.  This process will put you ahead of the curve, give you players to monitor, and give you first crack at picking them up.

Thanks and be smart.


Use PITCH f/x Data To Identify Potential Breakout Pitchers (Part II)

Picking up where we left off in the post “Use PITCH f/x Data to Identify Potential Breakout Pitchers“, now that we’ve identified the potential pitchers (link to pitchers with differences) who have added a new pitch or that have significantly adjusted their pitch usage mix in 2013, we need to determine if the new or more heavily used pitch is successful.

Before We Go Any Further

I think it’s important you read the article The Internet Cried A Little When You Wrote That On It, by Mike Fast (follow Mike on Twitter).  The whole article will be helpful if you’re trying to improve you understanding of PITCH f/x, but at least read bullet #1.

My takeaway from that piece is that significant changes in pitch mix, especially within the fastball classifications (FA, FT, FC, FS, SI), are most likely to be changes in the algorithm used to classify the pitch.

Take for instance, Jake Peavy.  The PITCH f/x data I downloaded from Fangraphs and manipulated to identify “potentially” new pitches, shows the following for Peavy:

PitchClass2

Interpreting that chart, from 2012 to 2013, the Fangraphs data shows a decrease in the fastball (FA) of 19.9% and increase in the two-seam fastball (FT) of 26.7%.  That sounds interesting on the surface, no?  Decrease one pitch 20% and increase another?

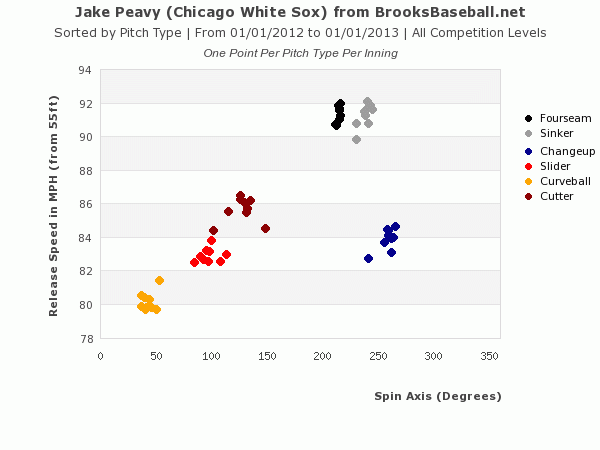
From Mike Fast’s article we know that we can’t necessarily trust the pitch classifications.  So let’s look at the 2012 velocity and spin on Peavy’s pitches:

PitchClass4
Click image to be taken to this page at BrooksBaseball.net

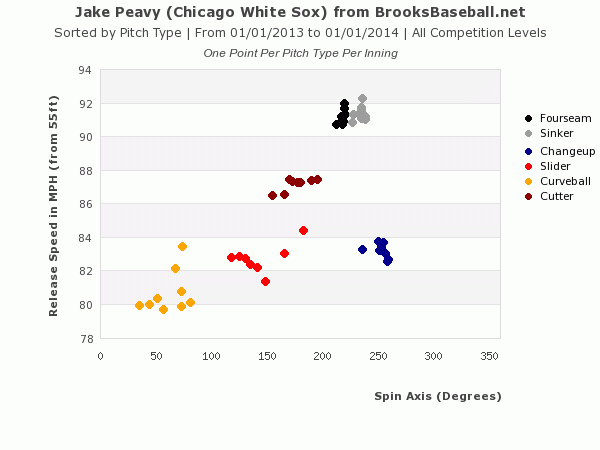
And the same for 2013:

PitchClass3
Click image to be taken to this page at BrooksBaseball.net

From these two charts you can see Peavy’s throwing the same pitches in 2013 that he was throwing in 2012.  The clusters are in the same general vicinity on the chart.  But more importantly, you can see there is very little difference between the fourseam (FA) and the sinker (BrooksBaseball calls the two-seam fastball a sinker (FT)).     So a 20% transfer from one classification to another is likely a change in the algorithm, as we were warned.

Give Me Someone Else to Look At

Alright, Alexi Ogando, although injured recently, has been intriguing.  The raw data shows a sharp decline in fastball usage and an increase in the changeup.  This probably isn’t just a case of an algorithm change (fastballs wouldn’t likely be misclassified as changeups).

PitchClass10

Let’s look at his 2012: Continue reading “Use PITCH f/x Data To Identify Potential Breakout Pitchers (Part II)”

Video: Use PITCH f/x Data To Identify Potential Breakout Pitchers (Part I)

I’ve talked before about the amazing tool we have at our fingertips in PITCH f/x.  I’ve also had two (Scherzer and Mujica) instances this season where I came across seemingly small anecdotes about a specific pitcher adding a new pitch, and the pitcher in question has gone on to have a “breakout” season thus far.  So I thought to myself…

Why Not Look For More Pitchers Who’ve Added A New Pitch

And rather than just share the results with you, I thought it might be more beneficial to share the method I used to do my search.  You know, the whole “teach a man to fish” proverb.

While there is a lot of great PITCH f/x data available at sites like Fangraphs and BrooksBaseball.net, I have not been able to locate a resource that allows me to do a year-to-year comparison of the data across a large pool of players (BrooksBaseball can show you great comparisons for a specific player).  So to identify these pitchers who have developed a new pitch, I had to download sets of data for 2012 and 2013 and apply some functions in Microsoft Excel.

I recognize that some of my posts get a bit lengthy and this process may have pushed the limits, so I’m trying something new and have put together my first YouTube video (if you’re interested in being notified of future videos, click here to subscribe to the SFBB YouTube channel).

About The Video

The video is approximately 15 minutes long, and takes you through a step-by-step process to download PITCH f/x pitch usage data from Fangraphs.com, pull the data into Excel, match up 2012 and 2013 pitch usages, calculate a difference in pitch usage, use the calculated difference to target players that are most likely throwing a new pitch in 2013, and how to use BrooksBaseball.net to conduct further research on individual pitchers.

Coming Soon

I’ll polish up the results and post an Excel file, containing pitchers to keep an eye on, for you to analyze.

Thanks for reading… and watching.  Stay smart.

Fantasy Baseball Tool Box – BaseballPress.com’s ‘My Lineup’ – Part II

Welcome to Part II of our look into Baseball Press’ “My Lineup” tool (read Part I here), an easy to use yet powerful tool that gives you batting order and lineup information for your specific fantasy players several hours before each game.  In the steps below we’ll take a look at how easy it is to set up an account and configure your lineup.  You can expect to be registered and have your players identified in less than 15 minutes.

 1.  Create Account

Visit BaseballPress.com and click the “Create Account” link on the top right corner of the page.

MyLineup1
Click “Create Account”

2.  Register

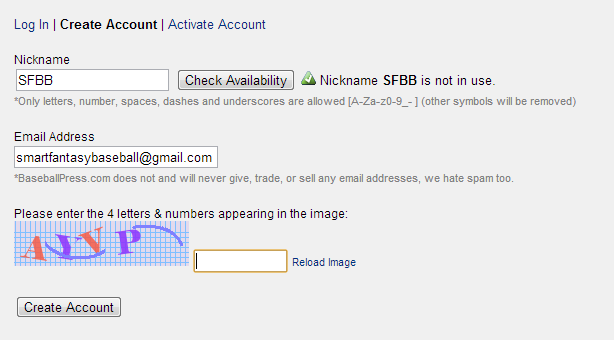
Create an ID / Nickname for your account and enter your e-mail address (you’ll be sent an email to validate the address).  After you’ve filled everything out (including the “prove you’re not a robot visual test”), click the “Create Account” button to proceed.


MyLineup2
Enter an ID and e-mail address.

3.  Activate Your Account

Continue reading “Fantasy Baseball Tool Box – BaseballPress.com’s ‘My Lineup’ – Part II”

Fantasy Baseball Tool Box – BaseballPress.com’s ‘My Lineup’ – Part I

It’s hard to believe that after a 162-game season involving rosters of 25 or more players, that a fantasy baseball championship could be decided by several counting stats (a few stolen bases, runs, etc.), but it’s true.  The final standings of any league can absolutely be affected by a simple strategy like making sure your daily lineup is full of players that are starting that day.

Final League Standings – Tied for First

Look at the “Total GP” column in the final batting statistics shown below.  While they tied for first, one team managed to squeeze out 46 more games played over the course of the season (2,155 – 2,109).  That’s an easy 2% of statistical output left on the table for “The Naturals” (46 / 2,109 = 2.2%).

Final Statistics – Tight Finish in R, HR, RBI, and SB

It’s probably not safe to do a straight extrapolation of the numbers, but a 2% increase in the final stat totals amounts to about 23 more R, 6 more HR, 21 more  RBI, and 3 more SB.  We can’t even see the full standings above, but that’s at least 1.5 more rotisserie points “The Naturals” left on the table.

And All I Had To Do Was Set My Lineup

“The Naturals” was my team.  I mustered a tie on the last day of the season.  But could have earned exclusive bragging rights by simply setting an accurate lineup every day.  I wish I had found BaseballPress.com’s “My Lineup” tool sooner.

What Is the “My Lineup” Tool?

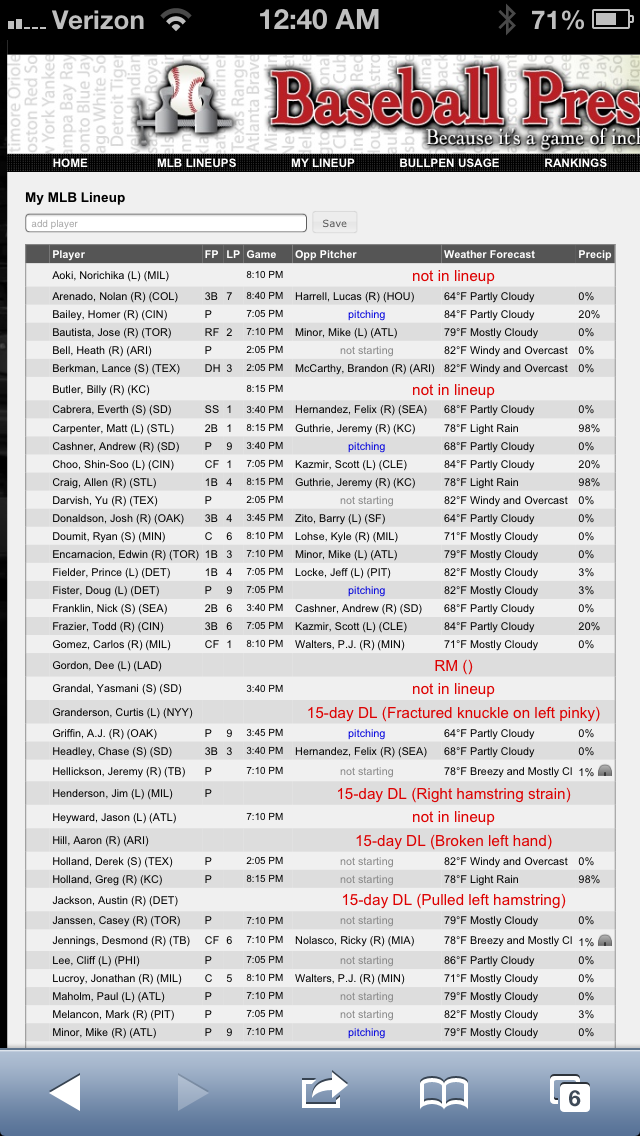
The guys at Baseball Press have created a free utility through which you can easily enter the players on your fantasy teams, save that list of players, and then check the “My Lineup” site to see which of your players is in/out of the lineup that day (look at the warnings for Norichika Aoki and Billy Butler bel0w).

MyLineupIntro3

I’m Not Impressed Yet.  What Else Does It Do?

In addition to acting as a central location where you can view the status of all your teams’ players, you’re also provided with where each player will hit in the batting order (the “LP” column), the opposing pitcher (and if they’re a RHP or LHP), and weather information.

As we have looked into before, where a player hits in the batting order is a significant component in a player’s level of production, so it’s great to see this information prominently displayed on the page (you don’t have to dig through 10 box scores to monitor where your players are hitting).

Weather information can help you avoid potential rain outs (see Allen Craig and Matt Carpenter facing a 98% chance of rain).  Great information in weekly H2H leagues or daily draft formats.

I’m Busy, I Don’t Have Time For Another Site To Visit

To be honest, that was my initial fear.  But Baseball Press prides themselves at being the first to publish accurate starting lineups.  I had no idea, but most times lineups are available several hours before the game.  I envisioned that I would have to diligently check “My Lineup” every night at 6:30PM to find it useful, but that’s just not that case.  It seems like lineups are often available up to four hours before game time and already entered in at BaseballPress.com.

The site is also easily accessible from any mobile device (the screenshot above is from my iPhone).  The facts that lineups are available hours before game time and available on my phone make it very easy to use.

How Much Is This Going To Set Me Back?

It’s free.  All you have to do is to create an account at Baseballpress.com and then add the players you want to monitor.

Is It Difficult To Set Up?

I found it very easy to create my account and add players.  I registered and had the players from four fantasy team rosters entered in about 10 minutes.

Up Next

In Part II of this look at BaseballPress.com’s “My Lineup” tool, we’ll go through step-by-step instructions to create your account and add players to your lineup, as well as a few tips on how to make the most of the site.

Special Thanks

Thanks to Reggie (follow Reggie on Twitter) and Nate (follow Nate on Twitter) of BaseballPress.com (follow the website’s own Twitter account), who have built this tool and agreed to let me spotlight it here.

Be smart.
Fantasy Baseball Tool Box – PITCH f/x Part II

Welcome to part two of our dive into PITCH f/x, a source of data you can use to take your analysis of pitchers to the next level.  In this installment, we’ll look more closely at the specific types of information that can be applied to fantasy baseball analysis.

In case you missed it, part one of the series covered an introduction of the PITCH f/x system, an overview of the types of information provided, and the best resources on the web to review PITCH f/x data.

Pitch Types

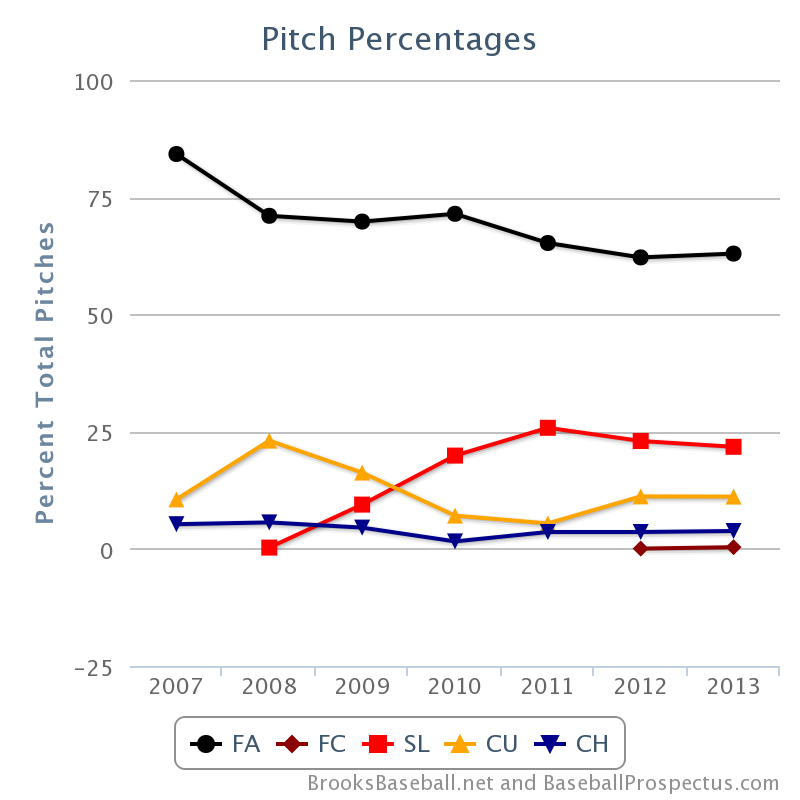
When doing analysis of PITCH f/x data, you will run across a system of abbreviations to classify pitches into different pitch-types.  For example, a player card for Clayton Kershaw at BrooksBaseball.net would display (among many others) the following pitch percentage chart:

KershawPitchFX050513
Clayton Kershaw Pitch-Type Chart from BrooksBaseball.net

The abbreviations FA, FC, SL, CU and CH stand for Fastball, Cut Fastball, Slider, Curve, and Changeup.  You might have figured many of these out, but the following table lists all abbreviations and their related pitch-type:

Abbreviation Pitch Type
FA Fastball
FT Two-seam Fastball
FC Cut Fastball (Cutter)
FS Sinking Fastball / Split-Fingered (Splitter)
FO Pitch Out
SI Sinker
SL Slider
CU Curveball
KC Knuckle-curve
EP Eephus
CH Changeup
SC Screwball
KN Knuckleball
UN Unidentified

Pitch Velocity

Each player card at  BrooksBaseball.net is usually clearly labelled with “mph” in the header.

Velocity

When using the PITCH f/x data at Fangraphs, note that velocity statistics have a “v” prefix (vFA is Fastball Velocity, vCU is Curveball  Velocity, etc.).  This table at Fangraphs can easily be sorted by velocity to see the hardest throwers.

PitchVelocity
2012 Fastball Velocity (vFA) leaders from Fangraphs.com.

And remember, Fangraphs data can be exported into a csv file for use in other analysis.

ExportPitch Outcomes – BrooksBaseball

In addition to tracking the pitch-type and velocity, the outcome of each pitch is tracked.  BrooksBaseball.net breaks down balls and strikes by pitch-type (called strike or swinging strike).  Swings are then broken down into balls put in play (BIP), fouls, and swings and misses (whiffs).  Finally, balls put in play (BIP) are then divided into ground balls, line drives, fly balls, and popups.

pitchfx3-050513

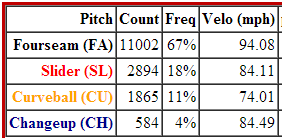
I believe there must be some pitch outcome results that are unknown, because the math doesn’t always work out in these tables.  Take the chart above, for instance.  For any pitch type, the ball percentage, called strike percentage, and the swing percentage should add up to 100%.  A hitter can either have a ball called, a strike called, or they can swing. But 18.20% + 48.08% + 19.70% = 98.50%.  Similarly, when the batter swings, the outcomes can be a foul, a swing and miss (whiff), or the ball in play (BIP).  But for the fourseam fastball, 19.70% + 8.18% + 20.70% = 48.58%, not the 48.08% swing percentage.  Outside of some inconsistencies like this, the data is great.

Sabermetric Outcomes – BrooksBaseball

The Sabermetric Outcomes table provides some very useful figures for analysis.  The “Whiff/Swing” figure tells what percentage of time a player misses when they decide to swing.  This can indicate if a pitcher has “swing and miss stuff”.  You can look at this trend over time to see if strikeout skills are improving or deteriorating.  It may also indicate that if a pitcher were to change his pitch mix/composition, that a change in strikeouts might occur.  For example, if you see that Kershaw is begins to throw more or less sliders, his best “swing and miss” pitch at 42.38%, his total strikeouts might be more significantly affected.

pitchfx4-050513

Plate Discipline – Fangraphs

On the Fangraphs pitching leaders page, it’s possible to view a “Plate Discipline” breakdown PITCH f/x data .

pitchfx050513

The plate discipline statistics will contain some measures relevant for fantasy baseball like  the frequency of swings at pitches outside the zone (O-Swing%), frequency of swings at pitches inside the zone (Z-Swing%), and the frequency a batter makes contact with a pitch inside the strike zone when they’ve decided to swing (Z-Contact%).

pitchfx2-050513Thanks, and Stay Tuned

You now know how to locate PITCH f/x data and do some basic analysis.  More specifically, you know how to view pitch mix/composition, you know how to read the pitch type abbreviations, how to locate pitch outcome data, and how to download certain reports for use again later on.

In an upcoming post we’ll take a look at a  real-life example of how to use this data for player analysis.

Be smart.

Fantasy Baseball Tool Box – PITCH f/x

If you’re looking for another weapon to add to your fantasy arsenal, understanding and using PITCH f/x data is a great place to start.  This article will give you an overview of what PITCH f/x is, what information it provides, and how and where you can obtain PITCH f/x data on the web.

What Is Pitch F/X?

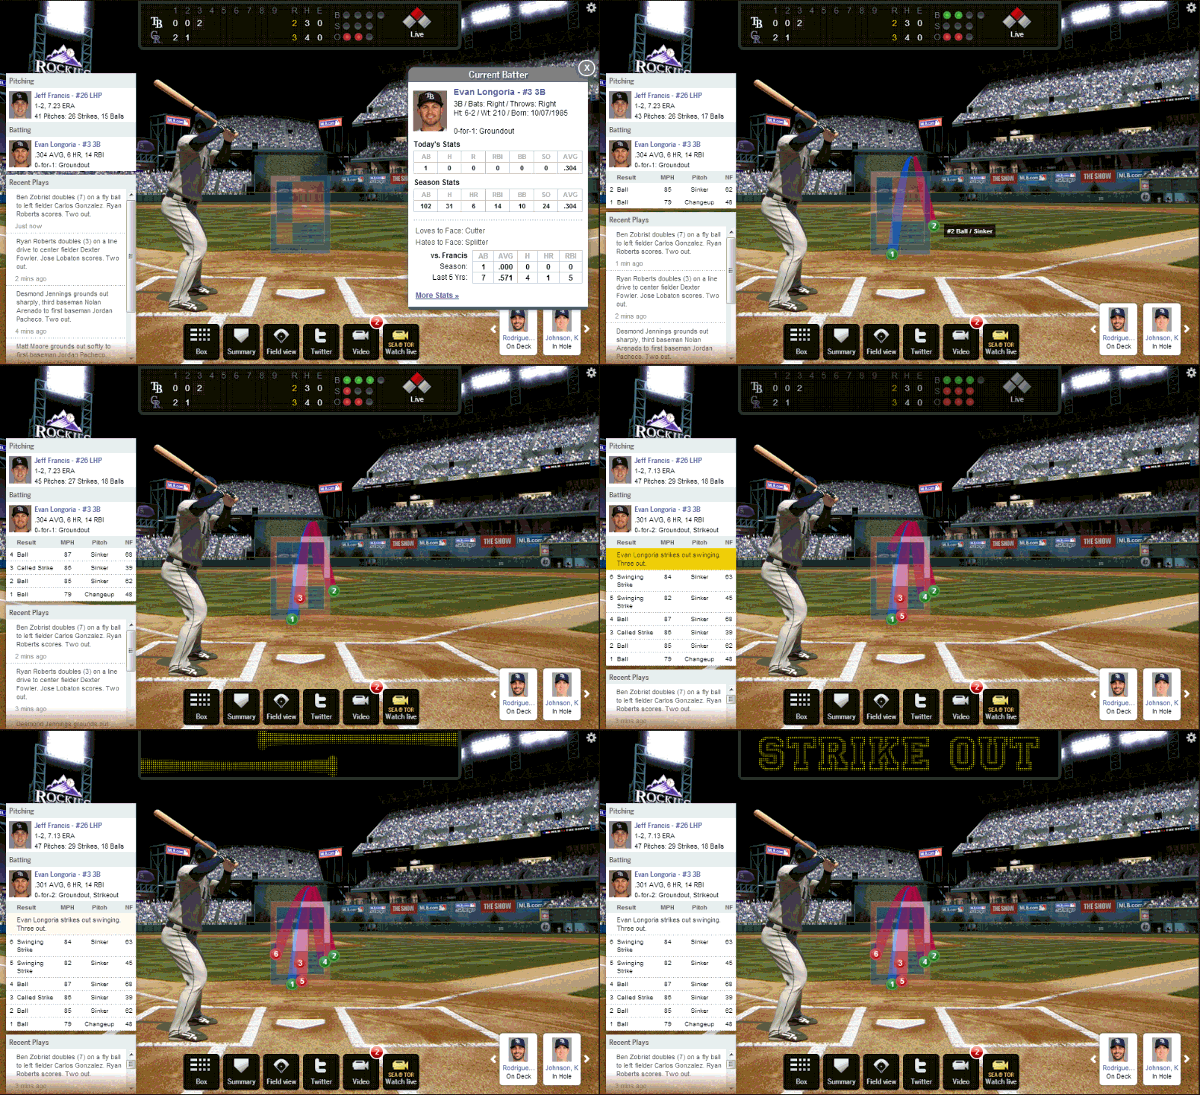
PITCH f/x is a system, developed by Sportvision, installed in all Major League Baseball stadiums to track the movement and velocity of pitches.  Even if you’ve never heard of PITCH f/x or analyzed PITCH f/x data, you’ve probably seen it in action via MLB.com’s Gameday system.  The pitch animations within Gameday attempt to model the actual velocity, break, and angle of pitches.

PITCH f/x animation from MLB.com’s MLB Gameday

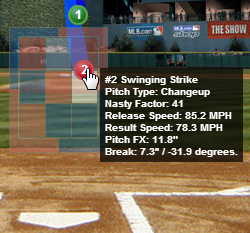
While watching the Gameday animation, if you hover over the location of a pitch, you are presented with the pitch result, pitch type, speed, and movement.

pitchfx1
PITCH f/x information from MLB.com’s MLB Gameday

What Does Pitch f/x Tell Me?

It’s interesting to look at the data of individual pitches, but because pitch-after-pitch-after-pitch is recorded and logged, we have accumulated a massive amount of pitch data that can be analyzed.  With pitch type, pitch speed, pitch movement, and pitcher release point being available, we can answer questions like:

  • Has pitcher A altered his approach (pitch type frequency)?
  • Has pitcher B added a new pitch?
  • Has pitcher C added velocity from the prior year?
  • Has pitcher D lost velocity on his fastball?
  • Has pitcher E improved the movement on his pitches?
  • Has pitcher F changed his release point?
  • What percent of the time does pitcher G throw his curve ball for a strike?
  • What pitch type for pitcher H generates the most swinging strikes?

What Does This Have To Do With Fantasy Baseball?

There are some very obvious applications.  For one, higher fastball velocity is an indicator of higher strike out rates.  Decreasing velocity might indicate an injured or aging player losing effectiveness.

Other PITCH f/x information is more difficult to tie directly to fantasy performance, but knowing the information might help explain changes in a player’s performance.  Take the case of Edward Mujica, who became a different pitcher after being traded to St. Louis in 2012.  Turns out he developed a new pitch that he now throws over 60% of the time.  Adding a new pitch and then throwing it with a high frequency would help explain an increase in effectiveness.

Fantasy players are always trying to determine what is real and what performance increases will continue.  PITCH f/x data can help unearth the “real” changes in pitcher performance and separate them from a flukey “hot streak”.

Where Do I Find Pitch f/x Data?

There are a number of resources for PITCH f/x data, but my two favorite sources are BrooksBaseball.net and Fangraphs.  BrooksBaseball.net offers a ton of information if you’re looking to take a deep dive into an individual player, whereas Fangraphs offers the easiest access to downloadable PITCH f/x data.

Brooks Baseball

BrooksBaseball.net offers PITCH f/x analysis of individual games, of umpires, and of the strike zone, but the pitcher “Player Cards” are what I find most useful for fantasy baseball analysis.

To access a player card, simply type the player’s name into the search box on the main site.  Then click the search button.

pitchfx2
BrooksBaseball.Net Player Card Search

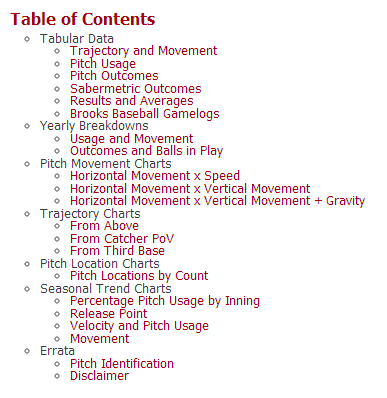
You’ll be presented with a lengthy table of contents showing just how much information is available on the site.

pitchfx3
BrooksBaseball.net PITCH f/x Player Card Table of Contents

We’ll dive deeper into certain segments in a future post.  But in the meantime, look around.  The information is awesome.

Fangraphs

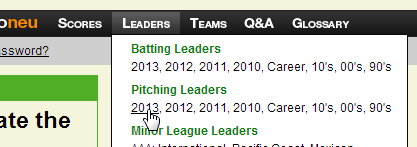
As mentioned above, Fangraphs offers the best sortable and downloadable PITCH f/x information I’ve been able to find.  To access this information, go to the “Leaders” menu at Fangraphs and select the desired year under “Pitching Leaders”.

pitchfx4
Accessing Fangraphs.com Pitching Leaders

Middle of the way down on the ensuing page, you’ll see categories for all the pitching statistics available at Fangraphs.  Choose “PITCH f/x”, the rightmost option.

pitchfx5
Locating PITCH f/x data on Fangraphs.

After making that selection, you have further options to choose from:  Pitch Type, Velocity, Movement, and others.

pitchfx6
Categories of PITCH f/x data available on Fangraphs.


More To Come

Play around with the information at BrooksBaseball and Fangraphs.  Leave a comment below or let me know on Twitter if you have any questions.

In an upcoming post, we’ll dive deeper into the data and do some analysis.

Special Thanks

A big thank you is in order to BrooksBaseball.net and Fangraphs.com for offering such great information online and making it available to smart baseball fans.

If You Haven’t Already Done So

Please subscribe to the Smart Fantasy Baseball blog with your e-mail on the top right of this page.  I won’t sell your e-mail address and you can unsubscribe at any time.  Promise.

Until next time, make smart choices.


The SFBB Twitter Lists

Where were you the night of April 27th, 2012?

I won’t soon forget getting off the couch that night, letting my dog out, and checking Twitter while I waited for her to come back inside.  News had hit Twitter that Mike Trout was being called up (you may remember that Bryce Harper was called up just hours before Trout).

I quickly went to all my league sites and picked up Trout and Harper in any leagues in which they were still available.

The point of this story is that Twitter helped me win two of my leagues in 2012.  It’s a great tool for alerting you to important fantasy events (injuries, call ups, closer changes) and aggregating fantasy news and articles from around the web.

The web is full of A TON of great and free fantasy baseball content and Twitter is an invaluable tool for helping you locate that information.

Getting Started

If you need a primer on Twitter, Brien Bonneville over at thefakebaseball.com has a great introduction and some tips for new users.  As a technology lover, I especially like the suggestion to download and use a Twitter dashboard like TweetDeck.  Twitter’s interface is a little clunky.  Using a dashboard allows you to more efficiently access different features in Twitter, arrange and follow multiple streams, and access multiple Twitter accounts at once.

Who To Follow

For the last couple years, David Gonos has put out his list of 99 Fantasy Baseball Twitter Accounts You Should Follow.  There are probably thousands of fantasy baseball Twitter accounts out there and Gonos has done a great job of isolating some of the best.  You’ll see names like Matthew Berry, Jason Collette, Mike Gianella, Tristan Cockroft, and Ron Shandler on his top 99.

SFBB Tip – Twitter Lists

In my opinion, one of the most underutilized features on Twitter is “Lists”.  A Twitter “List” allows you to group and organize Twitter users.  You can subscribe to lists created by other Twitter users and others can subscribe to your own lists.  When you then visit a list, the Tweets from everyone in the list are displayed.

Subscribing to a list is different than following someone.  This is nice because you can easily segregate people you follow for personal reasons from others by using lists.  For example, if you subscribe to one of the lists below, you won’t have MLB injury news cluttering up your Twitter stream.  When you’re ready to do some fantasy baseball reading, you can then view the appropriate list.

Instead of you having to seek out fantasy baseball experts to follow, I’ve created created several Smart Fantasy Baseball Twitter lists you can follow.  You can see all the SFBB lists here, or visit the individual lists with the links below:

How To Subscribe To a List

  1. After clicking on one of the links above, locate and click on the “Subscribe” button in the top left corner of the page.
    TwitterList1
  2. Keep in mind that lists you have subscribed to do not hit your Twitter feed.  To view the contents of a list, after logging into Twitter, click on the “View my profile page” link.
    TwitterList062913
  3. Then click on the “Lists>” link, in the top left corner, to see all lists you are subscribed to.
    TwitterList3
  4. On the ensuing page you will see all of your lists.  The title of each list will be displayed along with who created it.
    TwitterList4
  5. Once you click to view a list, all the Tweets from members added to the list will appear in a feed for you to read.
    TwitterList5
  6. If you do make the jump to using a Twitter Dashboard, like Tweetdeck, you can add followed lists to the Dashboard and have them easily available (and avoid having to jump through these hoops above).
    TwitterList6

Who’s Missing?

Who are your favorite Twitter follows?  Is there anyone missing from the lists that you think should be added?  I don’t intend for the lists to be all encompassing, and I put a preference on quality over quantity.  There are also some fantasy baseball experts that don’t tweet much about fantasy baseball, so I excluded them (Gonos’ list of 99 had some that I left off my lists for that reason).

Stay Smart.  And thanks for reading.