Looking to get a jump on the 2020 season? Here are the Excel tools and books that are updated and ready to help you prepare for the upcoming season. If you’re looking to build skills and develop your own methods for ranking and valuing players, these are for you! All of the spreadsheet tools listed below have been updated for the 2020 season.
Co-authored with Jeff Zimmerman, this is our comprehensive guide of the process we use to succeed during a fantasy baseball season. From preseason preparations, the draft, and all the stages of the season, it’s everything we know about playing this game. The book is available in a PDF e-book for $17.99 here or in paperback form at Amazon here.
You can read a comprehensive writeup of all that’s included in the book here, including the foreword by Clay Link, the full table of contents, and testimonials by fantasy analysts like Rob Silver, Rudy Gamble, Eno Sarris, Mike Podhorzer, and Mike Gianella.
The Automated SGP Ranking Tool will help you convert your favorite projection set (Steamer, The Bat, Razzball, RotoWire, PECOTA, etc.) into Excel-based rankings and dollar values tailored to your own league’s settings. The process takes only minutes. No messy Excel formulas. Just load your projections into the file, adjust a few settings, and standings gain points rankings are calculated automatically. Click here to read more about the tool.
Powered by the same concepts as the Automated SGP Ranking Tool, the Automated Points League Ranking Tool does all the same things, just for nearly any imaginable points league. The tool works with any popular projection set and allows you to enter your league’s unique point scoring system, then instantly converts those projections into tailored point totals and dollar values. The process take minutes and will give a huge advantage over owners that are not tailoring rankings specifically to the league scoring system. Click here to read more about the points league tool.
An easy-to-use Excel spreadsheet that can combine (or average) up to three different projection sets. The aggregator can use just about any well-known projection set you can find on the web (if you find one that doesn’t work, let me know!). Simply download your favorite projection sets, fill out some settings, and you’re done. No complicated formulas or VLOOKUPS for you to add.
Ever wanted to create your own rotisserie rankings? This is my instructional guide written specifically to show you how to create customized rotisserie player rankings, dollar values, and inflation dollar values, in Microsoft Excel, tailored to your own league. No more downloading rankings from the web, hoping they apply to your unique league. 10, 12, or 15-team league? $260 or $300 budget? AL-only or mixed league? 10 hitters or 14? It doesn’t matter. This book will guide you through the process of developing rankings for just about any kind of rotisserie league.
My step-by-step guide to building custom rankings, dollar values, and inflation dollar values, in Microsoft Excel, for your points league. This book will guide you through the process of developing rankings for just about any point-based scoring format.
This year’s edition of The Process is now available!
About the Book
A very thorough and detailed write-up of what’s included in the book is available here. At a high level, this book is everything Jeff Zimmerman and I know about how to play rotisserie baseball (and even points leagues). Regardless your level of experience, I guarantee it includes pages and pages of unique ideas, research, and data you have never seen before. We continue to pour our new ideas, new research, and recent realizations into it. The e-book is 265 pages and includes 58 additional pages of appendices full of projections, statistics, and helpful information.
The paperback edition of the book can be purchased from Amazon.com by clicking here.
Keep reading for details on all that was added to this 2020 edition, but my favorite addition is a detailed study that performed on the 2018 NFBC Main Event, including all the player adds, player drops, and final standings of all 34 leagues and 510 teams. The study sought to confirm if the advice and strategies in the book can be observed and corroborated in the actions of the game’s best managers. The NFBC Main Event, with its $1,700 buy in, prestigious name, and overall competition aspect, offers the best laboratory to study this.
That new study delves into many topics:
How much does draft position affect the chances of winning a league?
Do better owners just accrue more playing time? Or are their players also accumulating more stats per AB and per IP? How much more?
How many free agent transactions do the best teams make?
How do these better owners spread their transactions throughout the season?
How do these better owners allocate their FAAB spending?
What bidding patterns can be observed from winning teams?
How do these owners allocate transactions between hitters and pitchers?
How often do these owners acquire two-start pitchers? Closers?
How much season-long value do these owners acquire and drop during the season?
How much weekly value do these owners acquire and drop during the season?
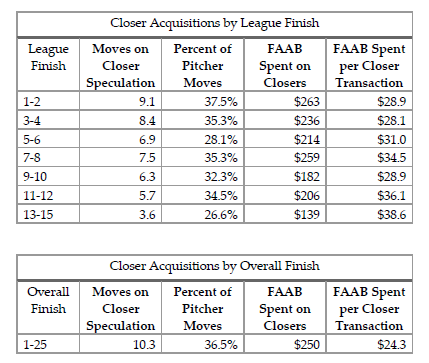
For example, here’s a table of data in the section analyzing how owners finish in the standings and the amount of moves spent on closer speculation.
Closer acquisitions in the 2018 NFBC Main Event.
A Personal Note
I’m really proud of this book. Or shall I say, this annual publication that we’ve started. But the intent to have annual editions creates a significant challenge. The book’s main strength is its long-term nature. Much of what we discuss are fundamental concepts to success at rotisserie baseball. Those ideas are not going to change much from year-to-year. It’s certainly going to be a test to keep the book relevant and worthy of your time and money. We understand that.
I am confident we can do this. Afterall, I’ve been writing on this site for several years now, exclusively with a long-term slant to my analysis. I don’t have much time to write. So I choose to focus my efforts doing research, writing instructions, and building tools that will have long-term benefits. I simply don’t have time to devote to writing short-term pieces that will be irrelevant within weeks or even days. Despite blogging for several years and having written a handful of books, I still feel as though we’re finding new ways to play and think about rotisserie baseball. I see no shortage of strategy-related questions to research.
You can see this in the topics we expanded in this year’s book. Among the higher-level strategy questions approached in this year’s book are:
Are rookies more volatile than established hitters? Does a rookie’s upside offset the possible downside? Do rookie projections differ from the projections of MLB regulars?
How much does a player’s previous levels of fantasy-production affect their future performance? Do these players offer a higher return on investment than those that have never before attained a given production level?
What are the key differences owners should know about the SGP and z-score player valuation models? Where are these systems similar?
How does the cost of closers during the draft compare to their cost in free agency (FAAB)? How does the cost of starting pitchers differ?
How much value should multi-position eligibility add to a player’s valuation? (Note: This topic was included last year, but we expanded our thoughts)
Having studied how weekly values appear in 12-team leagues during the 2017 season, how much did things change in 2018? How does the appearance of weekly values change in a 15-team league?
What do average weekly statistics lines look like for players? For example, what does a $30-35 weekly hitter line look like? What do valuable weekly pitcher statistics look like?
What strategies and behaviors can we observe from the NFBC’s amazing data (standings, adds, drops, etc.)? What behaviors lead to success? What beliefs about how to best play rotisserie baseball can we confirm by studying this data?
On top of all this, Jeff and I continue to evolve the way we play the game and we share those changes and decisions with you. Here are the new discussions of strategies, tips, and tools included this year:
We co-owned a team together this season. We share what we learned from this experience, both during the draft and in-season. Our general recommendation is that partnering is very helpful, especially for leagues where there is a grind of weekly transactions.
To that end, we outline the weekly FAAB process we went through together on that shared league. Having a consistent weekly routine is the key to uncovering valuable players and to avoiding under- or over-bidding. We share the process that works for us.
We outline the specific tools we use to identify FAAB targets and two-start pitchers. We also share the process we go through for setting lineups and finding important last-minute MLB news.
We explored different approaches to dealing with catchers this past season. We share the results of those strategies.
We share a FAAB binning strategy that helps owners stay disciplined about overbidding and maintaining a healthy weekly budget.
Do you have to read through the entire book hunting for what’s new? No! We kept track for you. You can see a full list of changes and jump right to the updated content. Here’s what that list looks like.
Please Click the ‘Buy Now’ Button Below to Purchase the e-Book for $17.99
After clicking the “Buy Now” button, you’ll be taken through an online checkout process using PayPal. There is also an option to pay with a debit or credit card. After completing the purchase, a link to download the PDF book will immediately be e-mailed to you. You can read the PDF on any mobile device, PC, or tablet.
Or Click Below to Buy the Paperback Edition at Amazon for $22.99
I’m a firm believer that using customized projections and running those through a valuation system, like standings gain points, is the single biggest leap a fantasy owner can take in improving at fantasy baseball. The problem with taking that step is it’s a significant hurdle to get over.
It’s complicated. It takes learning advanced Excel skills. It’s time consuming. It’s not for everyone.
I’ve been hard at work to help solve these problems. It’s taken several years, but I’m finally able to announce the new Automated SGP Rankings Excel Tool. With this Excel tool, you’ll be able to calculate rankings and dollar values from your favorite projection set within minutes. You can use Steamer, any other Fangraphs projection set, Rotowire, Mastersball, and even PECOTA. Whatever projection set you have access to should work.
You can have tailored rankings and dollar values within minutes using the Automated SGP Rankings Tool.
Interested in learning more about this tool? Watch the following video or click here to read all about its features.
The Automated SGP Rankings Excel Tool is now available for the 2019 season! This tool will save you huge amounts of time. You won’t be stuck troubleshooting Excel formulas. You can focus on player research and forming your own opinions about players. You’ll have custom dollar values to make decisions from. Those values will be tailored to your league’s specific settings. It’s a great step toward winning your league this upcoming season.
The Excel tool currently works with the following rotisserie categories:
Hitting Categories
Pitching Categories
Runs (R)
Wins (W)
Home Runs (HR)
Saves (SV)
Runs Batted In (RBI)
Strikeouts (K)
Stolen Bases (SB)
Earned Run Average (ERA)
Batting Average (BA)
Walks + Hits per Inning Pitched (WHIP)
On Base Percentage (OBP)
Quality Starts (QS)
Slugging Percentage (SLG)
Holds (HD)
On Base Plus Slugging (OPS)
Saves + Holds (SV+HD)
Click here to read more about its features and to purchase the tool.
I partnered Jeff Zimmerman (Fangraphs, Rotowire, Fantrax, multiple-time Tout Wars Champ) to write this comprehensive e-book guide (PDF) that outlines the start-to-finish process we go through during a fantasy baseball season. Please click here to buy The Process e-book.
How to Win Your League
The book is a chronological guide through the fantasy baseball season, with the main goal being to help you win your league. The topics covered are:
Use of Projections
How to Adjust Projections
How to Convert Projections to Values/Rankings
How to Adjust Values and Rankings
Draft & Auction Preparation
Draft & Auction Strategy
In-season Management & Strategy
End-of-season Management & Strategy
Wrapping Up the Season
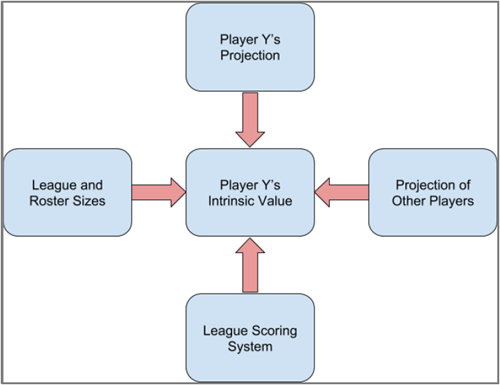
Player valuation and how it is determined are big themes in the book.
As you read through that list, you may be thinking, “I already know that topic,” or, “What more could be said about that?” But that is what I’m most proud of. I think we managed to provide unique perspective, insights, and studies that have not been seen before.
If you’re not an experienced owner and you’re looking for a place to start, The Process can help you too. It is a comprehensive guide, but we also present shortcuts and alternate ways of doing things. You can pick and choose the topics or areas in which you want to expand your game. Adding one or two new strategies or tactics to your own process each season is a great way to improve over time.
I’m also very proud of the way we were able to weave in a lot of theory, so owners are not just presented with a way of doing things, but can also understand the “why”, so it can be applied to similar situations in the future.
Cognitive biases and other decision-making concepts are also sprinkled throughout the book. We believe this combination of process, theory, and decision-making tactics makes The Process a unique tool for fantasy owners.
Tell Me More About What’s Included
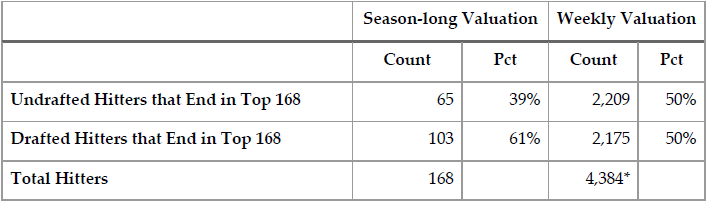
One of the more interesting studies included in the book is around the concept of weekly player values. Much of the research and decision-making fantasy owners do centers around annual valuations for players. Yet outside of draft and hold leagues, we don’t make decisions on an annual time horizon. Most owners must make decisions on a weekly or even daily basis. A study of weekly player valuations sheds light on how well we capture value in the preseason, what kinds of players create weekly value, and when new value appears during the season.
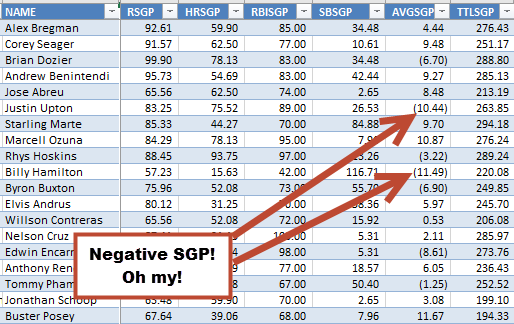
This table is one of many in a study of how well fantasy owners do at capturing weekly hitter and pitcher value.
The book also includes average standings data and standings gain points calculations for many popular league variations. Save hours of time having to calculate these yourself!
Example AL-Only OBP Average League Standings Data
This data is provided for the following league types:
15-team, Standard League (14 hitters, 9 pitchers)
15-team, 1-Catcher League (2 utility hitters)
15-team, OBP League (instead of batting average>
15-team, Draft and Hold League (no in-season pickups)
12-team, Standard League
12-team, OBP League
12-team, AL-only Standard League
12-team, NL-only Standard League
12-team, AL-only OBP League
12-team, NL-only OBP League
What Do Others Have to Say?
You don’t just have to take my word for it. Some of the minds I most respect in the fantasy baseball community have taken the time to read the book and offer their feedback (Rob Silver, Rudy Gamble, Eno Sarris, Mike Podhorzer, Mike Gianella). You can see what they had to say here.
Please Click the ‘Buy Now’ Button Below to Purchase the e-Book for $17.99
After clicking the “Buy Now” button, you’ll be taken through an online checkout process using PayPal. There is also an option to pay with a debit or credit card. After completing the purchase, a link to download the PDF book will immediately be e-mailed to you. You can read the PDF on any mobile device, PC, or tablet.
Click here to see a list of participants The Great Fantasy Baseball Invitational. I’m in League 13.
I recently participated in my The Great Fantasy Baseball Invitational (TGFBI) draft, which, if you’re a Twitter user and follow anyone in the fantasy baseball landscape, you could not have avoided. I do want to share with you some observations I had during the draft, but similar to my other writings, the goal here is to give some actionable advice (even if you’re reading this in the future) and not get too hung up on my team and specific players.
The Context
The invitational is made of 13 separate 15-team leagues. Each of these leagues will compete like any traditional rotisserie league and crown a champion within that league. The twist is that there is also an overall competition across the 13 leagues, whereby all 195 teams are competing in one massive rotisserie competition to crown an overall champion (similar to how the NFBC works). The one person that emerges atop 194 other experts can surely claim to be one of the best fantasy baseball players around.
This is the inaugural year of the competition, but it’s such an innovative idea that there’s no shortage of well-known folks competing. You can see the full list of participants here.
I’m participating in League #13. I happen to be the last name on the roster of the last league! What does that tell you, ha! You can see the draft results here. I was picking from the fifth spot.
My Feelings Going Into the Draft
While I’m obsessed with fantasy baseball, I really don’t view myself as anything special in this arena. Sure, I’ve MacGyver’ed up some neat spreadsheet tools over the years. But I don’t view my preparation process as anything special. I DON’T DO ANYTHING YOU’VE NEVER HEARD OF BEFORE. I’m not holding back any secret tricks of the trade.
And because I don’t do anything special, I was nervous as hell heading into this draft. I joked a few paragraphs back about being the last name on the last league. I don’t really know if that’s indicative of anything, but even if it is, I get it! I don’t even think I’ve written five legitimate articles in the past two years. It wouldn’t surprise me if that’s the lowest output of any participant involved. Meanwhile, many of the others are busting their backs to write articles and create podcasts on an aggressive and regular schedule.
These guys and gals are painstakingly combing over StatCast data, spin rates, hard hit rates, launch angles, swinging strike rates, and more… Meanwhile, I pretty much just let them do the work, read their articles, listen to their podcasts, plop some projections into a spreadsheet, make some manual adjustments, and I’m ready to rock with a comprehensive list of players and expected earnings dollar values.
Alright. Enough about me. Let’s try to make this useful. I apologize if some of what follows comes across as inflammatory or soap-boxy. Not everything can be sugar-coated. Here are my top lessons learned and observations after participating in this draft.
#1 – Exploit the League Rules
I really, really, really didn’t want to start with this one. It’s what EVERY SINGLE introduction to fantasy sports article ever written in the history of the world has started with.
So you would have expected that every one of the 195 participants would have done this, right?
But guess what??? I’m speculating, but I’d bet less than half of the TGFBI participants gave the rules a worthwhile look (I do realize saying “the TGFBI” is probably redundant, but it looks too weird not to do it). They probably assumed we were playing by prototypical standard rules and just checked to determine if we were using batting average or on-base percentage. But there are two rules we are playing by that are not exactly “standard” and each was something that I think needed to be known going into the draft. These two rules should have affected your behavior in the draft, and possibly in a significant way. Those two rules are:
Starting rosters include only one catcher but two utility spots
Rosters allow for five reserves and up to five DL spots for injured players
Pretty simple stuff, but small differences in rules, like starting one catcher instead of two, can have a significant effect on player valuation.
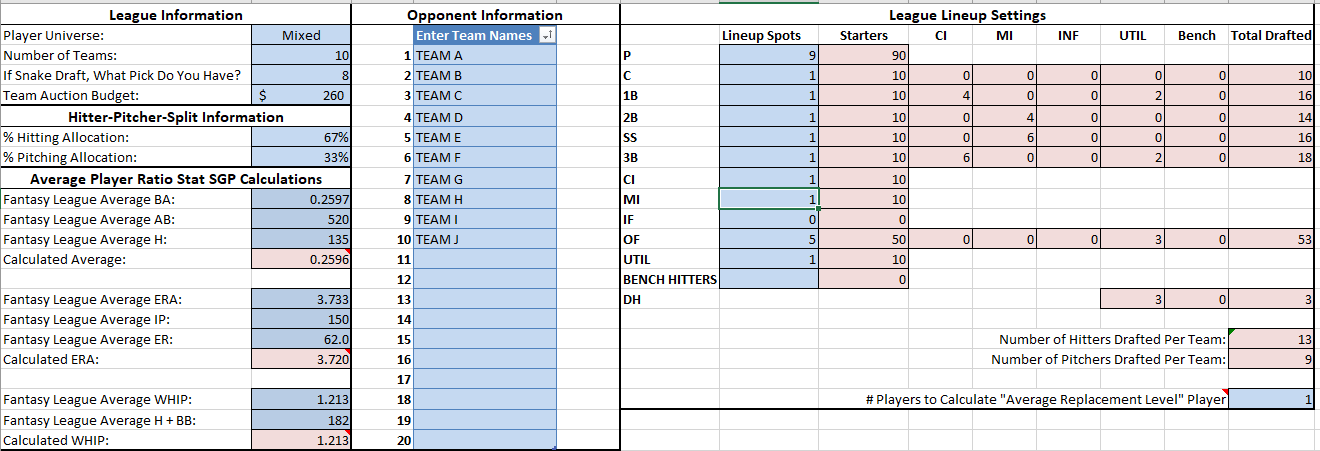
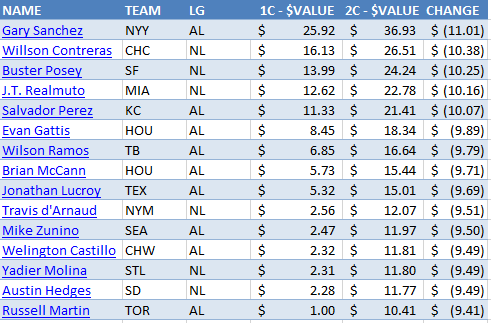
Why does this matter? In a 15-team league, I show the effect of going from two starting catchers to one as having around a $10 swing in value! That is an ENORMOUS detail (Note: the values in the image reflect the change from 2 C & 1 UTIL to 1 C & 2 UTIL, not just the move to 1 C).
The fact that this change is so significant surprises some people. But these are the same objective calculations that tell me Mike Trout, Trea Turner, Jose Altuve, Chris Sale, Clayton Kershaw, and Max Scherzer should be the highest valued players for the 2018 season. This isn’t speculation or “feel” about how to adjust for position scarcity. If you want to read more about the reason for this, here’s an illustrated example I put together from a few years ago.
As some of the faster drafting leagues started to get into the second and third rounds, we saw the big name catchers start to go. Then word quickly spread over Twitter, “This is a one-catcher league.” The effect quickly kicked in and the catchers starting plummeting. I’m a little disappointed this had to spread like a juicy rumor. I’d have expected everyone to know this going in.
I also suspect that many folks were worried the rules allowed for five reserve spots and no recourse for injured players. I believe this is how NFBC leagues and Fantrax leagues that allow for transactions operate (e.g. NFBC Main Event). I don’t have hard evidence to support this claim, but it just seemed like injured players like Michael Brantley, Michael Conforto, Jimmy Nelson, and Alex Reyes were going later than they should have been. My guess is they’d have been pushed up draft boards aggressively had everyone known this.
Small tip here. I don’t mind pushing up these injured players when you have a realistic way of replacing them that won’t burden you (force you to keep dead weight on your roster). Not only do you secure a talented player at a discount, you get the added benefit of being able to take chances on the waiver wire early in the season, when the odds are higher that you’ll be able to find a hidden gem.
My takeaway here is to not take anything in the rules for granted. Comb over them. Think about what the wrinkles in the rules might allow or incentivize you to do. Tailor your rankings and calculate your dollar values with these rules in mind. And don’t assume your enemies are doing the same. This can be an edge.
#2 – Use Dollar Values Tailored to Those League Rules to Make Decisions
My stance on this is simple and straightforward. If you’re not drafting with a set of projection-based dollar values in mind, you can do better.
I don’t care if you calculate them yourself, if you use the Fangraphs auction value calculator or the Rotowire custom dollar values, or if you buy a piece of software that does it for you… You’re not optimizing your chances of winning if you’re not drafting from values. You need a framework for comparing two hitters to each other, for comparing a hitter to a pitcher, and for making educated decisions. This is what dollar values do! Without dollar values, you’re being subjective. You’re letting biases creep into your decision making.
I don’t know exactly how every analyst drafts, but based on following folks on Twitter, reading certain sites, and discussions I’ve had with people, I’m pretty certain these folks all do value-based drafting:
Most of the concepts used in the standings gain points process of valuing players are straightforward. If there’s one facet of the process that causes the most confusion, it’s the handling of ratio statistics like batting average and WHIP. In the piece that follows, I’ll revisit the basics of what makes ratios statistics different and then I’ll get into two very specific and more complicated questions I often see.
How do you determine the baseline (or league average) ratio to compare the player pool to?
What if you don’t use an accurate measure for that baseline?
A player cannot hit a “negative home run” or “lose strikeouts”. Each counting stat helps you move closer to the next team in the standings. So when we are calculating SGP for a player, the counting stats all evaluate out to a positive number. For example, if we determine based on 2017 standings that it takes 8.526 home runs to move up one spot in the standings, Dee Gordon’s two home runs still calculate out to 0.2346 standings gain points. They’re still beneficial in an absolute sense.
Ratio Stats are Messy
When it comes to rotisserie scoring of ratio stats, we are not judged in that same manner. A player with a poor batting average or a bad earned run average can lower your score within those categories. You can have negative ratios that cause you to lose points or fall in the standings. A player can have a negative SGP for a ratio category.
How Do We Calculate SGP for Ratio Stats?
NOTE: This part is a refresher. If you already have a general understanding of how this works, skip down to the next bolded heading.
If we assume a league of 12 teams and 14 hitters on each team (adjust for your roster size), that is 168 players (12 * 14). In the Steamer projections, the top 168 major leaguers are projected for an average of about 509 at bats per player.
This means the average team in this fantasy league will have approximately 7,126 at bats (14 players * 509 at bats). According to Razzball, the average rotisserie batting average in 12-team leagues was .267. This means the average team had approximately 1,902 hits (7,126 * .267). And the average player had 136 hits (1,902 team hits / 14 players).
To find the impact of Trout we need to remove one “average” player from the team and then add in Trout’s projections. We can do the same for Tulowitzki.
13 “average” players * 509 at bats = 6,617
13 “average” players * 136 hits = 1,768
Before I start getting into the intricacies of that process, it’s important to understand that the approach we use to calculate SGP for ratio stats is to find an individual player’s effect on that ratio stat for an AVERAGE team in the standings.
Here’s a closer look at how you would do this for batting average:
Step
Description
1.
You first need to know what your fantasy league’s average batting average was. In this example, let’s say it’s .267.
You then need an approximation of how many at bats it took to generate that average. In this example, I determined that 168 players (12 teams * 14 players per team) would average 509 at bats. (more on how this was determined later!)
4.
Using that information, derive the number of hits the average player had. Knowing the league average and the number of at bats, we can easily figure out that the average player would have had 136 hits (.267 * 509 = 135.9).
5.
Next, you extrapolate the 136 hits and 509 at bats per player to team totals. But not a full team of players. ONE LESS PLAYER THAN A FULL TEAM (PER YOUR LEAGUE’S SETTINGS). We’re trying to figure out what an average team looks like without the one player we’re trying to rank.
In this example of a 14-player roster, we’ll use 13 players (one less than a full team). This means the average team (minus one player) would have 1,768 hits (13 * 136) and 6,617 at bats (13 * 509).
It’s CRITICAL that these two numbers hold true to your league average stat. Notice that 1,768 divided by 6,617 is still .267.
6.
Then, you add in the projection for the player being evaluated and DETERMINE THE TEAM’S RATIO STAT WITH THAT PLAYER. Assume a player is projected for a .300 average on 200 hits and 667 at bats. The calculation would be:
= (1,768 hits + 200 hits) / (6,617 at bats + 667 at bats)
= 1,968 hits / 7,284 at bats
= .27018 AVG
7.
Finally, determine the effect of the individual player by subtracting the average team’s ratio (from step 1 above) from the recalculated team ratio with the player, then divide by the SGP factor.
In our example, this calculation would be:
= (.27018 – .267) / 0.0019
= 1.6737 SGP
Instead of using a player with a .300 average, assume we used a player that dragged the team average down to .264. For this player, the SGP calculation would be:
= (.264 – .267) / 0.0019
= -1.5789 SGP
Negative standings gain points! I said this cannot happen with counting stats… But it CAN AND WILL HAPPEN with ratio stats.
How Do You Determine the Baseline (or League Average) Ratio to Compare the Player Pool to?
When you read through that description above, things generally make sense. But when you actually try to reperform that process, you’ll quickly realize I skipped some steps and take some liberties…
Here are the Excel tools and books I have available for the 2018 season. You won’t find draft lists or player profiles here. But if you’re looking to build skills and to develop your own methods for ranking and valuing players, these are for you! All of the spreadsheet tools listed below have been updated for the 2018 season.
An easy-to-use Excel spreadsheet that can combine (or average) up to three different projection sets. The aggregator can use just about any well-known projection set you can find on the web (if you find one that doesn’t work, let me know!). Simply download your favorite projection sets, fill out some settings, and you’re done. No complicated formulas or VLOOKUPS for you to add.
Ever wanted to create your own rotisserie rankings? This is my instructional guide written specifically to show you how to create customized rotisserie player rankings, dollar values, and inflation dollar values, in Microsoft Excel, tailored to your own league. No more downloading rankings from the web, hoping they apply to your unique league. 10, 12, or 15-team league? $260 or $300 budget? AL-only or mixed league? 10 hitters or 14? It doesn’t matter. This book will guide you through the process of developing rankings for just about any kind of rotisserie league.
My step-by-step guide to building custom rankings, dollar values, and inflation dollar values, in Microsoft Excel, for your points league. This book will guide you through the process of developing rankings for just about any point-based scoring format.
In order to prepare for the upcoming season, we need some important information from last year. In this post, I’ll share with you the average standings for 12- and 15-team NFBC leagues, and the average ERA, WHIP, and batting average in those leagues. With this information, you should have everything you need to get started on your SGP rankings for the 2018 season.
The last several years, I’ve participated in the NFBC’s Draft Champions competition. By participating in such a league, a user gets access to see the standings to all the various NFBC competitions.
As far as I can tell, it seems like you need to be a registered NFBC user to see the standings data. If you happen to be one (and you’re logged into the NFBC site), you can see standings data for the various contests at these links:
I take this data and manipulate it in Excel to calculate average standings across all the leagues using the process I describe here.
If you are not an NFBC user, you can see some of the historic analysis I’ve compiled from 2012 through 2016 here.
With that in mind, let’s take a look at the 2017 results.
12-team League Average Standings
Across the 149 Online Championship leagues hosted by NFBC, the average standings for first through twelfth are shown below. Note, the 1,156 RBI is the average of all teams that finished in first place in RBI. It is NOT the average of what league winners averaged in the RBI category. The league winner in RBI could have finished in 7th place overall, but is included in the 1,156 average figure.
RK
PTS
AVG
R
HR
RBI
SB
ERA
WHIP
W
K
SV
1
12
.2788
1,178
365
1,156
174
3.480
1.171
107
1,522
105
2
11
.2750
1,144
349
1,121
159
3.638
1.204
102
1,469
97
3
10
.2727
1,125
340
1,098
149
3.740
1.222
98
1,435
90
4
9
.2706
1,108
332
1,080
142
3.827
1.238
96
1,403
85
5
8
.2688
1,091
324
1,061
135
3.891
1.250
93
1,372
81
6
7
.2674
1,078
317
1,045
129
3.960
1.263
90
1,341
76
7
6
.2660
1,064
310
1,027
123
4.027
1.276
88
1,313
70
8
5
.2643
1,048
303
1,011
117
4.100
1.287
85
1,282
65
9
4
.2626
1,029
296
992
111
4.171
1.300
82
1,245
59
10
3
.2609
1,010
288
972
105
4.263
1.316
78
1,209
51
11
2
.2588
983
277
948
96
4.375
1.336
73
1,150
40
12
1
.2543
937
258
896
80
4.557
1.366
66
1,057
26
12-team League SGP Factors
Using the information from the league average standings, the raw and relative SGP factors are as follows:
Here are the Online Championship hitting categories:
Year
Type
BA
R
HR
RBI
SB
2012
Raw
0.00220
19.197
8.016
20.675
8.270
2013
Raw
0.00193
19.265
7.537
20.685
8.603
2014
Raw
0.00197
18.843
7.481
19.639
7.900
2015
Raw
0.00177
19.920
8.429
19.549
7.591
2016
Raw
0.00182
19.721
8.797
21.527
8.508
2017
Raw
0.00193
19.060
8.526
20.635
7.405
2012
Relative
0.00011
0.92848
0.38769
1.000
0.40001
2013
Relative
0.00009
0.93136
0.36435
1.000
0.41589
2014
Relative
0.00010
0.95950
0.38094
1.000
0.40224
2015
Relative
0.00009
1.01898
0.43115
1.000
0.38828
2016
Relative
0.00008
0.91607
0.40863
1.000
0.39520
2017
Relative
0.00009
0.92366
0.41320
1.000
0.35885
Here are the Online Championship pitching categories:
Year
Type
ERA
WHIP
W
K
SV
2012
Raw
(0.07840)
(0.01320)
3.253
30.968
7.184
2013
Raw
(0.07623)
(0.01472)
2.899
32.811
7.038
2014
Raw
(0.06880)
(0.01280)
2.999
31.181
6.964
2015
Raw
(0.07876)
(0.01464)
2.926
35.163
7.210
2016
Raw
(0.08042)
(0.01529)
3.184
34.212
6.842
2017
Raw
(0.08587)
(0.01548)
3.288
37.244
6.461
2012
Relative
(0.00253)
(0.00043)
0.10503
1.000
0.23197
2013
Relative
(0.00232)
(0.00045)
0.08837
1.000
0.21452
2014
Relative
(0.00214)
(0.00040)
0.09320
1.000
0.21640
2015
Relative
(0.00224)
(0.00042)
0.08321
1.000
0.20505
2016
Relative
(0.00235)
(0.00045)
0.09307
1.000
0.19998
2017
Relative
(0.00231)
(0.00042)
0.08827
1.000
0.17348
15-team League Average Standings
The NFBC offers two different types of 15-team leagues. The “Main Event” is a closer approximation to your typical home league, in that it allows for in season player pickups from the waiver wire. The Draft Championship does NOT allow in-season moves, but you do draft a 50-player team in order to build a deeper roster that might get you through the season without the ability to add anyone.
There were some big waves in the nerdy baseball world (I’m a proud card-carrying member) last week, when Baseball-Reference.com released a redesigned website. While the improvements are very nice, especially on a mobile device, the unfortunately broke the link to the Projecting X 2.0 spreadsheet.
Unfortunately, the newly designed site doesn’t seem to allow for the web querying function that was used to extract several of the pieces of information necessary to project pitcher stats. Because of this, we’ll have to make a few small edits to your spreadsheet that will allow you to link directly to the player you are projecting so that you’re taken right to the table containing the desired information (if we can’t pull it into the file, we’ll create a link that takes you right to where the information is located).
What follows are instructions that will help create these helpful hyperlinks and add them to your spreadsheet.
As much as I love the standings gain point approach to valuing players, it does have an a couple of inherent weaknesses.
First, it’s dependent upon some form of league history to work. The whole ranking and valuation process is derived from previous standings data! Those starting new leagues, or joining an existing league, don’t have this information available.
Second, assuming you have prior standings to draw from, I’ve always been bothered by the small sample sizes of that data. And I don’t know about you, but something odd always seems to happen in my leagues. One year someone runs away with it, one year it’s a tight race between five teams, one year we add two teams, the next year we contract a team.
Thankfully, some very generous league hosting sites have made their standings information publicly available or shared it with me! With their help, I think we can put to bed the concerns over lack of league history and small sample sizes. We have MANY leagues to look at now.
The fine folks at OnRoto.com have shared their NL- and AL-only standings data. If you’re not familiar with OnRoto, their goal is to cater to sophisticated fantasy leagues, many of which play by the “old-school” rules required by “long-term players”. They also are willing to fulfill just about any customization request (more on this later!).
I’ve also written several times about NFBC standings data for mixed leagues.
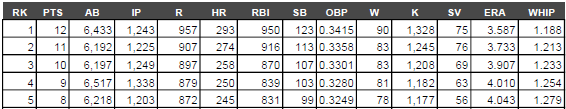
Here are the average AL statistics within each rotisserie scoring category:
RK
PTS
AVG
R
HR
RBI
SB
ERA
WHIP
W
K
SV
1
12
0.272
987
291
964
128
3.583
1.191
94
1,311
90
2
11
0.268
945
274
926
115
3.753
1.227
88
1,271
79
3
10
0.266
917
262
894
107
3.856
1.245
85
1,229
72
4
9
0.264
889
254
867
100
3.934
1.258
82
1,194
64
5
8
0.262
867
245
846
94
4.014
1.271
80
1,159
57
6
7
0.260
844
236
823
89
4.079
1.286
77
1,133
52
7
6
0.259
824
227
793
83
4.160
1.298
74
1,108
46
8
5
0.257
804
217
773
78
4.225
1.310
72
1,083
40
9
4
0.255
777
207
747
73
4.280
1.322
70
1,048
36
10
3
0.253
743
195
714
67
4.386
1.339
66
1,005
30
11
2
0.250
711
184
681
61
4.525
1.360
61
961
21
12
1
0.246
636
162
604
49
4.728
1.392
55
901
11
To better explain what you’re looking at, a team could have finished in 10th place in the standings but still finished 1st place in the home runs category. That team’s data appears on the “Rank 1” row, not on the “Rank 10” row.
We use cookies to ensure that we give you the best experience on our website. If you continue to use this site we will assume that you are happy with it.