So you’ve got a great set of projections, rankings, and dollar values.
This is great for draft preparation. But how do you take this information and use it during the draft? Is there a way to monitor the progress of the draft and see if you’re lacking in power compared to the others in the league? Do you need speed? Are you lacking in strikeouts?
You don’t need to buy draft software or a special draft spreadsheet. You can easily add a few more things to your Excel files and have a very powerful draft tool that can help you make these assessments.
I wrote about how to track drafted players in a spreadsheet last January. If you haven’t read that yet, please do. The instructions that follow pick up where that post leaves off.
Here’s how to calculate projected standings during your draft.
Prerequisites
I’ll be using Excel 2013 to create the projected standings. I think you’ll be able to follow a very similar process in Excel 2010 and Excel 2007.
 As I mentioned, this post assumes you have already added the named range and data validation drop down listing to select the team that has drafted a player.
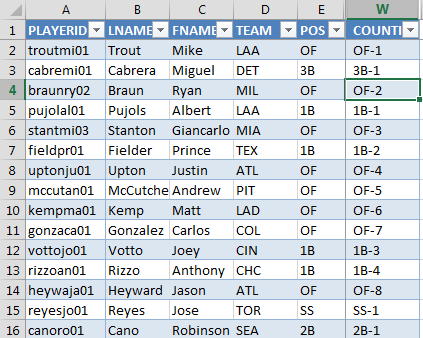
This is how you will be tracking the draft selections during your draft. As each player is taken, you’ll locate them on your rankings/projections lists and select the team that drafted them.
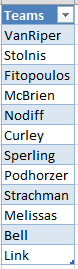
I realize it’s a little early to be thinking about draft spreadsheets, but it’s top of mind for me now because I am participating in a mock draft that was coordinated by Bryan Curley of BaseballProf.com. I wanted to see how the draft is going and how teams stack up after the first few rounds. Not to mention you can set this up in your spreadsheet now and have it read to roll when we finally get closer to the season.
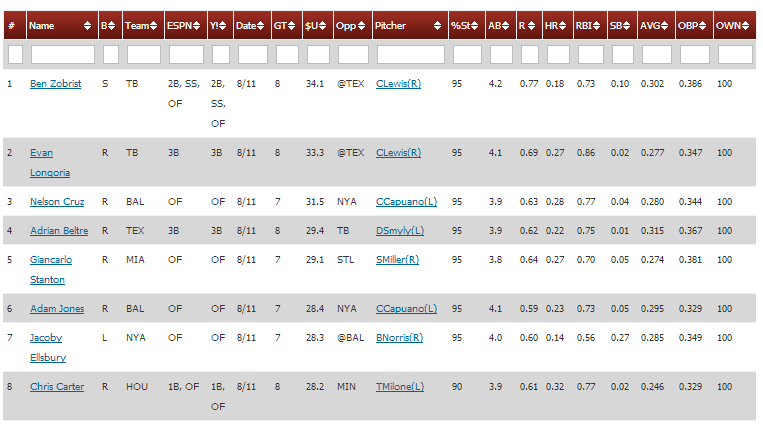
You can see the list of those participating in the mock draft in image above. As selections are being made in the draft, I’m marking them off in drop down I created in the “TAKEN” column.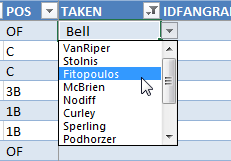
You may want to make several “fake” selections in your Excel file, just to have some data to work with. You will want to test that your projected standings are working prior to the draft… That’s the last thing you need to be monkeying on draft night.
Excel Functions and Features We’ll Be Using
There are a variety of ways to do this, but I’ll show you how to use a pivot table in this example. If you’ve never created a pivot table before, don’t worry. They’re a lot easier to work with than most think.
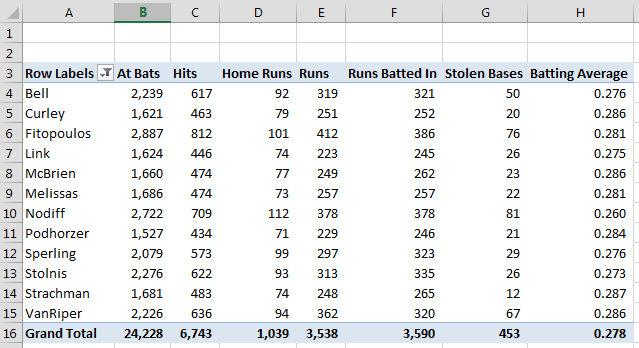
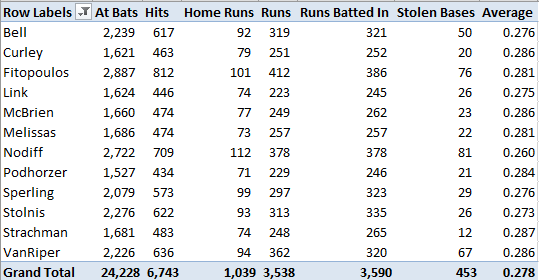
The pivot table will help us to quickly accumulate every team’s offensive stats (R, RBI, HR, SB, BA). Once we have the statistics accumulated in one nice table, we’ll then use the RANK formula to calculate the standings.
Pivot Tables
Pivot tables are very useful for taking a lot of lines of data (like we have on our “Hitter Ranks” tab) and combining or summarizing that data into more easily or digestible parts.
For example, your listing of all hitters and their projections is probably hundreds of rows of information. If you were to select 14 hitters for each of the 12-teams in your league, that would be 168 hitters. Sorting all of those players into teams and then calculating the totals for five different categories for each team might seem like a daunting task.
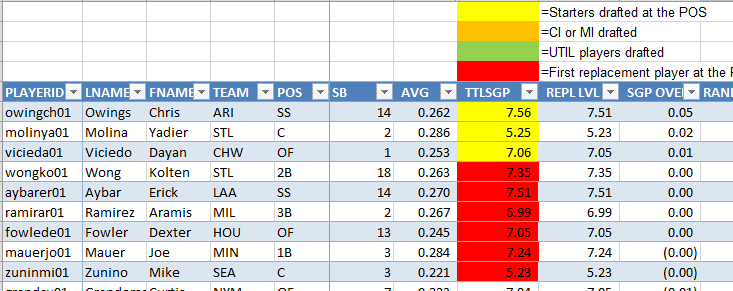
The good news is that creating a pivot table can be done in only a few clicks of the mouse and within minutes you can have a table that looks just like this:
Rank (or RANK.EQ) Formula
These two formulas are essentially the same; however, RANK was discontinued in Excel 2010 and was replaced by RANK.EQ.
If you’re using Excel 2010 or later, either one should work. But if you are using Excel 2007 or earlier, you must use RANK (RANK.EQ didn’t exist then).
These formulas will interpret a list of numbers and return the ranking of a specified item in the list. We can use this to analyze the entire list of player SGPs and give us a ranking for each player (e.g. Mike Trout is #1).
The formulas require three inputs:
RANK(Number, Ref, Order)
RANK.EQ(Number, Ref, Order)
- Number – This is the specific number you want ranked. If your goal is to figure out where your team ranks in total home runs, you would select the individual cell containing your team’s projected home runs.
- Ref – This is the range of data, or the list of data, to calculate the ranking from. Continuing with the total home runs example, you would select the entire listing (or range) of projected home runs for all teams in the league.
- Order – Technically this is not a required part of the formula, but using it can make our lives a little easier. If you leave this part out of the formula, Excel would return a “1” for the team with the most home runs and a “12” for the team with the least home runs. You can see we don’t really want to know our “Rank”. We’re looking for “Rotisserie Points”. We would like the top team in home runs to show a “12”. The “Order” parameter in the RANK function is looking for a zero or a one. If you leave it blank or put in a zero, the RANK function gives a “descending” ranking. This is the typical ranking where “#1” is the best or highest possible ranking. We are looking for an “ascending” ranking, where a “12” is the best result. To do this, just put a one in for this piece of the function.
Step-by-Step Instructions
Continue reading “How To Calculate Projected Standings For Your Draft”
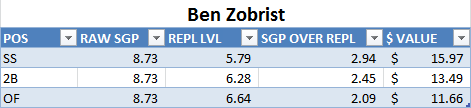
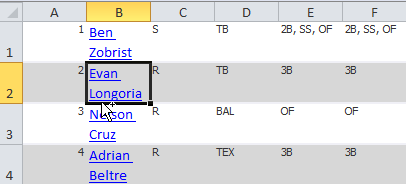
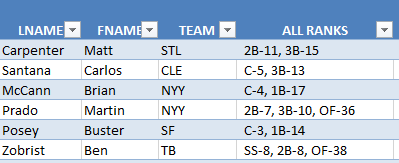 How do we handle the multi-position players like Ben Zobrist and Martin Prado? When a player is eligible to be slotted at 2B, SS, and OF, how do we value that player?
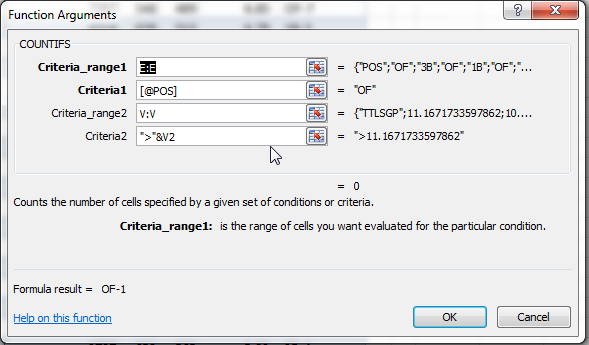
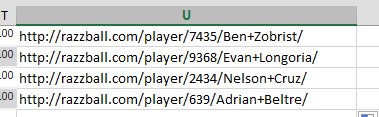
 There’s not even an existing Excel formula we can use to just pull out the web address. We have to get a little advanced and create our own.