 How do we handle the multi-position players like Ben Zobrist and Martin Prado? When a player is eligible to be slotted at 2B, SS, and OF, how do we value that player?
This question came up in the comments of my last post on “How to Add Positional Ranking to Your Spreadsheet“, from a reader named Michael (I welcome your questions too). In this post I’ll take a look at how I handle this and look at a more inticate approach you could take to get the information.
I must warn you that it takes a lot of new formulas and manipulation of your existing rankings spreadsheet to accommodate multiple positions. To make sure you have something to reference, at the end of this post I’ll provide a download link to an example Excel file you can download.
Assign the Player to the Weakest Position They’re Eligible For
This is what I currently do. For example, let’s take a player like Ben Zobrist, who in the 2014 season currently qualifies at SS, 2B, and OF.
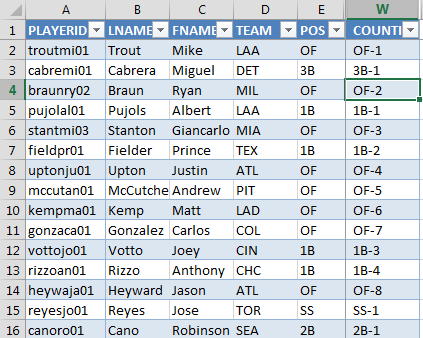
In the Player ID Map, I attempt to classify each player at the weakest position they’re eligible for. I do that by determining what replacement level is for a standard 12-team mixed rotisserie league.
Is the “weakest position” going to be the same for every league? No it’s not. It’s probably close in most leagues. Catcher will almost surely be the weakest in any format. Then Shortstop will generally be the next weakest, followed by 2B, 3B, 1B, and OF. But positions might change a little in an 8-team league or a 15-team league, in an AL-only league versus a standard league.
That’s a big reason why I started this site. It’s not always safe to give blanket advice, and I think the best approach is to calculate all of these things for your own league. You’ll be better off for it.
How Do I Determine the Weakest Positions?
Assuming you’ve done some kind of work to create your own rankings (if not, start here), the weakest position can easily be determined by looking at the replacement level information you’ve calculated (if you want to refresh your memory on replacement level, read this).
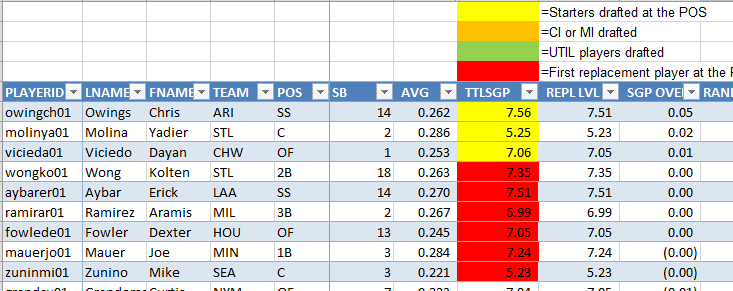
Looking back to one of my preseason files for the 2014 season, this is the replacement level information for one of my leagues.
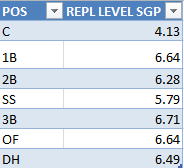
The weaker positions are those with the lowest replacement level. So in this league it’s C, SS, 2B, and then 1B, 3B, and OF are essentially the same.
Back to Zobrist
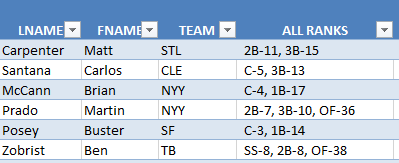
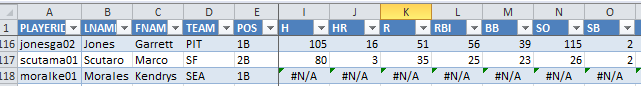
Going back to our example of Ben Zobrist who is eligible at SS, 2B, and OF, if we’re trying to assign him to the weakest position he’s eligible for, he would be assigned to SS.
Thinking of Martin Prado who is eligible at 2B, 3B, and OF, he would be assigned to 2B.
Carlos Santana who is eligible at 3B and C would be assigned to C.
Why Do I Only Assign a Player to One Position?
I have two reasons for this.
The main reason is because assigning players to the weakest position they are eligible for gives the player his greatest value. I’ll demonstrate more on this in a minute. But if you’re calculating Zobrist’s dollar value, it comes out highest when he’s classified as a SS.
Going along with this, fantasy baseball leagues are becoming more efficient market places. As we all get better and smarter about playing fake baseball, people generally realize they’re best off putting Buster Posey at catcher and not at 1B.
This won’t always be the case, but for the most part the obvious situations like your Buster Poseys and Carlos Santanas are going to be assigned where they belong. Because of this, it’s somewhat of a wasted effort to try calculating values for them at 1B or 3B.
The second reason is a technological one. You run into a lot of trouble having the same player appear multiple times in one spreadsheet (on multiple rows). Not only does it become confusing to have to remember that Zobrist’s name appears three times in your draft list, but it also greatly complicates (or eliminates) your ability to calculate dollar values.
How Much Does a Player’s Position Affect Their Value?
Is there really a big difference between a SS and an OF? Let’s take a look.
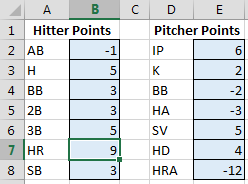
I am running the exercise below using Steamer’s 2014 preseason projections. The dollar values assume a 12-team standard mixed rotisserie league with 14 hitters (C, C, 1B, 2B, 3B, SS, CI, MI, OF, OF, OF, OF, OF, UTIL) and 9 pitchers. The dollar values are calculated using standings gain points and my approach to calculating player values.
Here’s the replacement level information again:
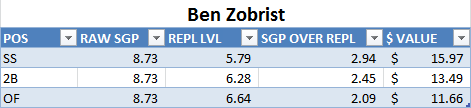
Let’s start out with Zobrist. You can see below that he was projected for 8.73 SGP before adjusting for replacement level. When you then account for replacement level and figure out his “SGP Over Replacement Level” you see that he becomes much more valuable as a shortstop. Over $4 more valuable than when he’s classified as an OF!
 Continue reading “How Do You Account For and Value Players with Multiple Position Eligibility?”

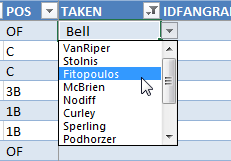
 As I mentioned, this post assumes you have already added the named range and data validation drop down listing to select the team that has drafted a player.