“The Process – 2020 Edition” Now Available

This year’s edition of The Process is now available!

About the Book

A very thorough and detailed write-up of what’s included in the book is available here. At a high level, this book is everything Jeff Zimmerman and I know about how to play rotisserie baseball (and even points leagues). Regardless your level of experience, I guarantee it includes pages and pages of unique ideas, research, and data you have never seen before. We continue to pour our new ideas, new research, and recent realizations into it. The e-book is 265 pages and includes 58 additional pages of appendices full of projections, statistics, and helpful information.

The paperback edition of the book can be purchased from Amazon.com by clicking here.

Want more detail about the topics covered in the book? You can see the table of contents here.

Want a testimonial that the book is this thorough and contains the value we say? You can read a Clay Link’s (RotoWire, 2018 TGFBI Overall Champion) introduction to the 2020 edition here. Or you can see what many other respected fantasy analysts (Rob Silver, Rudy Gamble, Eno Sarris, Mike Podhorzer, Mike Gianella, Tim Heaney) had to say about the 2019 edition here.

My Favorite New Part

Keep reading for details on all that was added to this 2020 edition, but my favorite addition is a detailed study that performed on the 2018 NFBC Main Event, including all the player adds, player drops, and final standings of all 34 leagues and 510 teams. The study sought to confirm if the advice and strategies in the book can be observed and corroborated in the actions of the game’s best managers. The NFBC Main Event, with its $1,700 buy in, prestigious name, and overall competition aspect, offers the best laboratory to study this.

That new study delves into many topics:

  • How much does draft position affect the chances of winning a league?
  • Do better owners just accrue more playing time? Or are their players also accumulating more stats per AB and per IP? How much more?
  • How many free agent transactions do the best teams make?
  • How do these better owners spread their transactions throughout the season?
  • How do these better owners allocate their FAAB spending?
  • What bidding patterns can be observed from winning teams?
  • How do these owners allocate transactions between hitters and pitchers?
  • How often do these owners acquire two-start pitchers? Closers?
  • How much season-long value do these owners acquire and drop during the season?
  • How much weekly value do these owners acquire and drop during the season?

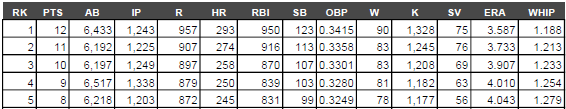
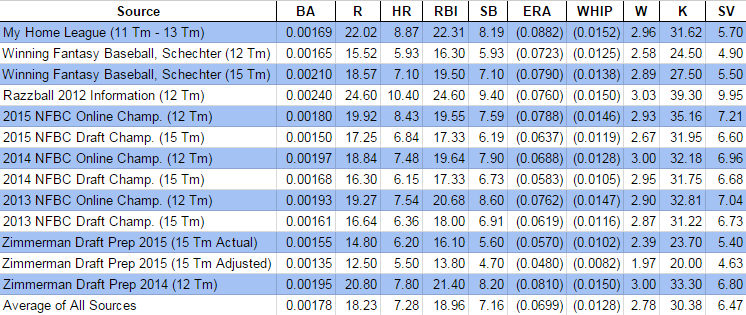
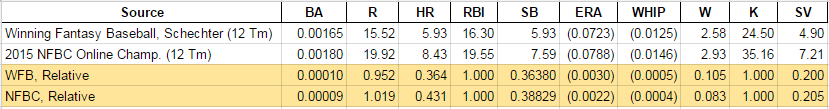
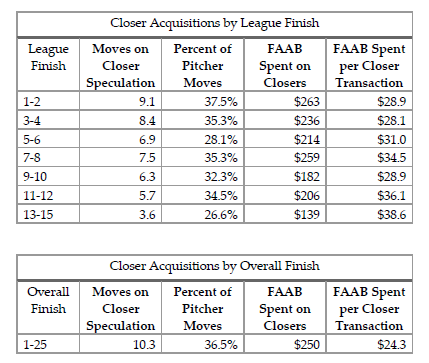
For example, here’s a table of data in the section analyzing how owners finish in the standings and the amount of moves spent on closer speculation.

Closer acquisitions in the 2018 NFBC Main Event.


A Personal Note

I’m really proud of this book. Or shall I say, this annual publication that we’ve started. But the intent to have annual editions creates a significant challenge. The book’s main strength is its long-term nature. Much of what we discuss are fundamental concepts to success at rotisserie baseball. Those ideas are not going to change much from year-to-year. It’s certainly going to be a test to keep the book relevant and worthy of your time and money. We understand that.

I am confident we can do this. Afterall, I’ve been writing on this site for several years now, exclusively with a long-term slant to my analysis. I don’t have much time to write. So I choose to focus my efforts doing research, writing instructions, and building tools that will have long-term benefits. I simply don’t have time to devote to writing short-term pieces that will be irrelevant within weeks or even days. Despite blogging for several years and having written a handful of books, I still feel as though we’re finding new ways to play and think about rotisserie baseball. I see no shortage of strategy-related questions to research.

You can see this in the topics we expanded in this year’s book. Among the higher-level strategy questions approached in this year’s book are:

  • Are rookies more volatile than established hitters? Does a rookie’s upside offset the possible downside? Do rookie projections differ from the projections of MLB regulars?
  • How much does a player’s previous levels of fantasy-production affect their future performance? Do these players offer a higher return on investment than those that have never before attained a given production level?
  • What are the key differences owners should know about the SGP and z-score player valuation models? Where are these systems similar?
  • How does the cost of closers during the draft compare to their cost in free agency (FAAB)? How does the cost of starting pitchers differ?
  • How much value should multi-position eligibility add to a player’s valuation? (Note: This topic was included last year, but we expanded our thoughts)
  • Having studied how weekly values appear in 12-team leagues during the 2017 season, how much did things change in 2018? How does the appearance of weekly values change in a 15-team league?
  • What do average weekly statistics lines look like for players? For example, what does a $30-35 weekly hitter line look like? What do valuable weekly pitcher statistics look like?
  • What strategies and behaviors can we observe from the NFBC’s amazing data (standings, adds, drops, etc.)? What behaviors lead to success? What beliefs about how to best play rotisserie baseball can we confirm by studying this data?

On top of all this, Jeff and I continue to evolve the way we play the game and we share those changes and decisions with you. Here are the new discussions of strategies, tips, and tools included this year:

  • We co-owned a team together this season. We share what we learned from this experience, both during the draft and in-season. Our general recommendation is that partnering is very helpful, especially for leagues where there is a grind of weekly transactions.
  • To that end, we outline the weekly FAAB process we went through together on that shared league. Having a consistent weekly routine is the key to uncovering valuable players and to avoiding under- or over-bidding. We share the process that works for us.
  • We outline the specific tools we use to identify FAAB targets and two-start pitchers. We also share the process we go through for setting lineups and finding important last-minute MLB news.
  • We explored different approaches to dealing with catchers this past season. We share the results of those strategies.
  • We share a FAAB binning strategy that helps owners stay disciplined about overbidding and maintaining a healthy weekly budget.

Do you have to read through the entire book hunting for what’s new? No! We kept track for you. You can see a full list of changes and jump right to the updated content. Here’s what that list looks like.

Please Click the ‘Buy Now’ Button Below to Purchase the e-Book for $17.99

After clicking the “Buy Now” button, you’ll be taken through an online checkout process using PayPal. There is also an option to pay with a debit or credit card. After completing the purchase, a link to download the PDF book will immediately be e-mailed to you. You can read the PDF on any mobile device, PC, or tablet.


Or Click Below to Buy the Paperback Edition at Amazon for $22.99

Click here to buy The Process – 2020 Edition: Integrating Valuations and Biases into a Winning Fantasy Baseball Formula at Amazon.com.

“The Process – 2019 Edition” Now Available

The Process is now available!
Twitter 1500x500

I partnered Jeff Zimmerman (Fangraphs, Rotowire, Fantrax, multiple-time Tout Wars Champ) to write this comprehensive e-book guide (PDF) that outlines the start-to-finish process we go through during a fantasy baseball season. Please click here to buy The Process e-book.


How to Win Your League

The book is a chronological guide through the fantasy baseball season, with the main goal being to help you win your league. The topics covered are:

  • Use of Projections
  • How to Adjust Projections
  • How to Convert Projections to Values/Rankings
  • How to Adjust Values and Rankings
  • Draft & Auction Preparation
  • Draft & Auction Strategy
  • In-season Management & Strategy
  • End-of-season Management & Strategy
  • Wrapping Up the Season

Player valuation and how it is determined are big themes in the book.

As you read through that list, you may be thinking, “I already know that topic,” or, “What more could be said about that?” But that is what I’m most proud of. I think we managed to provide unique perspective, insights, and studies that have not been seen before.

If you’re not an experienced owner and you’re looking for a place to start, The Process can help you too. It is a comprehensive guide, but we also present shortcuts and alternate ways of doing things. You can pick and choose the topics or areas in which you want to expand your game. Adding one or two new strategies or tactics to your own process each season is a great way to improve over time.

I’m also very proud of the way we were able to weave in a lot of theory, so owners are not just presented with a way of doing things, but can also understand the “why”, so it can be applied to similar situations in the future.

Cognitive biases and other decision-making concepts are also sprinkled throughout the book. We believe this combination of process, theory, and decision-making tactics makes The Process a unique tool for fantasy owners.

Tell Me More About What’s Included

One of the more interesting studies included in the book is around the concept of weekly player values. Much of the research and decision-making fantasy owners do centers around annual valuations for players. Yet outside of draft and hold leagues, we don’t make decisions on an annual time horizon. Most owners must make decisions on a weekly or even daily basis. A study of weekly player valuations sheds light on how well we capture value in the preseason, what kinds of players create weekly value, and when new value appears during the season.

This table is one of many in a study of how well fantasy owners do at capturing weekly hitter and pitcher value.

The book also includes average standings data and standings gain points calculations for many popular league variations. Save hours of time having to calculate these yourself!

Example AL-Only OBP  Average League Standings Data
Example AL-Only OBP Average League Standings Data

This data is provided for the following league types:

  • 15-team, Standard League (14 hitters, 9 pitchers)
  • 15-team, 1-Catcher League (2 utility hitters)
  • 15-team, OBP League (instead of batting average>
  • 15-team, Draft and Hold League (no in-season pickups)
  • 12-team, Standard League
  • 12-team, OBP League
  • 12-team, AL-only Standard League
  • 12-team, NL-only Standard League
  • 12-team, AL-only OBP League
  • 12-team, NL-only OBP League

What Do Others Have to Say?

You don’t just have to take my word for it. Some of the minds I most respect in the fantasy baseball community have taken the time to read the book and offer their feedback (Rob Silver, Rudy Gamble, Eno Sarris, Mike Podhorzer, Mike Gianella). You can see what they had to say here.

Please Click the ‘Buy Now’ Button Below to Purchase the e-Book for $17.99

After clicking the “Buy Now” button, you’ll be taken through an online checkout process using PayPal. There is also an option to pay with a debit or credit card. After completing the purchase, a link to download the PDF book will immediately be e-mailed to you. You can read the PDF on any mobile device, PC, or tablet.


How to Analyze SGP Denominators from Different Sources

Do you know if the SGP calculations you’ve done for your league are accurate?

Are you concerned that your home run SGP denominator is 8.87 and Larry Schechter’s book Winning Fantasy Baseball suggests using 5.93 for a 12-team league? Or that your RBI calculation shows 22.31 and the 12-team NFBC history I just calculated shows 19.55?

What does this all mean? Will your rankings be accurate? How can they be when your denominators seem significantly different than those you see elsewhere?

Calm Down, These Numbers Are More Consistent Than You Realize

I know. You’re wondering how on Earth I can say that. How can a HR denominator of 8.87 be consistent with one of 5.93?

To be honest, I’ve had those same fears about SGP. I feel so scientific and strategic by calculating SGP. And then I look at my denominators in comparison to what I see published elsewhere and that confidence evaporates and is replaced with doubt.

In this post I’m going to share an important realization I just had about SGP (yep, I’m still learning too), show you how to properly compare your SGP denominators to different resources, and demonstrate that the dollar values calculated by different sets of denominators are more similar than you would believe. When we’re done here, I think we’ll all feel a lot more comfortable about things.

Story Time

This story starts with me calculating the SGP for the last three seasons of NFBC leagues (which make their standings information publicly available).

I read Winning Fantasy Baseball a couple years ago (if you haven’t read it and you’re about to read 2,500 words on SGP denominators, you really should get the book), and I vaguely remembered the book giving SGP denominators for a variety of league types. I wanted to verify that my findings were similar to Schechter’s.

Here’s what I found:

Source BA R HR RBI SB
2015 12-team NFBC Online Championship 0.00180 19.92 8.43 19.55 7.59
Winning Fantasy Baseball 12-team League 0.00165 15.52 5.93 16.30 5.93

Damn. WTF does this mean? Those don’t look close to me. Did I do something wrong?

A Very Important Point

As I looked more closely at the book, I noticed I missed a very important point the first time I read it. Next to each number, Schechter had calculated a “relative SGP value”.

SGP Type BA R HR RBI SB
Raw SGP Denominator 0.00165 15.52 5.93 16.30 5.93
Relative SGP Denominator n/a 1.05 2.75 1.00 2.75

And here’s the important point Schechter makes about these calculations:

… when you’re trying to adjust SGPs for leagues of various sizes, it’s important to realize that the raw value of the SGP isn’t very important, but rather the ratio of the values.

~ Larry Schechter, Winning Fantasy Baseball

Mine Is Bigger Than Yours Is

I glossed over that red bolded sentence on previous reads (because it’s not bolded red in the book…). But this small statement buried in the middle of the 350-page book is exactly the point I needed for the self-doubt I was experiencing.

So in order to hopefully save you the same trouble, take note! You can’t compare your SGP denominators to someone else’s. You have to convert them to a relative scale first.

Raw Versus Relative – An Example

Let’s focus in on just the HR and RBI stats from the table above.

SGP Type HR RBI
Raw SGP Denominator 5.93 16.30
Relative SGP Denominator 2.75 1.00

If it takes 16.30 RBI and 5.93 homers to move up the standings, this essentially means that one home run is 2.75 times more important than one RBI (home runs are more scarce, so getting one of those is more valuable than the more common commodity, RBI).

16.30 / 5.93 = 2.75

Do you remember working with fractions in elementary school? I liken this practice to that whole “lowest common denominator” charade we had to go through. Dropping the SGPs to a relative scale is like converting them to a lowest common denominator. If you leave the SGP factors grossed up at these high numbers (like 5.93 and 16.30), it’s more difficult to see the relationships you can see when they’ve been translated into the relative scale.

One More Math Concept

If you read Using Standings Gain Points to Rank and Value Fantasy Baseball Players or if you’re generally familiar with the SGP approach, you know that we would divide a player’s home run total by the home run “SGP denominator” to know how many SGP the player contributes due to his homers.

For example, if a player is projected by 30 home runs, an SGP denominator of 5.93 would indicate the player’s homers are worth 5.1 points in the standings (30/5.93=5.1). If the same player is projected for 83 RBI, an SGP denominator of 16.30 suggests the RBI are also worth 5.1 SGP (83/16.30=5.1). The 30 HR are worth the same as 83 RBI (5.1 SGP).

However, the way Larry Schechter has calculated his relative SGP would require you to multiply a player’s stats to achieve that same equality. For example, the 30 HR multiplied by 2.75 is 83 “points”. The 83 RBI multiplied by 1.00 is also 83 “points”. The 30 HR are worth the same as 83 RBI (83 relative SGP).

For Consistency, I Will Calculate Relative SGP Another Way

If you look back at the big bolded numbers above, Larry Schechter used the largest statistic (RBI for hitters and K for pitchers) as the numerator in his conversion. I will use it as the denominator.

5.93 / 16.30 = 0.364

I’m mostly doing this because everything I’ve written about SGP to this point tells you to DIVIDE BY THE SGP DENOMINATOR (heck, it’s called a denominator, meaning it’s on the bottom of the fraction). To now tell people to MULTIPLY BY THE RELATIVE SGP DENOMINATOR seems too confusing to me.

I’m sure I’ve confused the hell out of everyone at this point either way. And I apologize for this. But I think this topic is very important to understand. I’m giving it my best! Even if you’re confused, keep reading. I think this will all pull together very nicely in the end.

Going back to our example of a player with 30 HR and 83 RBI, if I divide by an SGP denominator of 0.364 I get that same 83 “points” (forgive the rounding), meaning the 30 HR are worth the same as the 83 RBI under this approach. So whether you use Schechter’s relative numerator and multiply or my relative denominator and divide, you get the same results.

How to Calculate “Relative” SGP Denominators

I’ve talked a lot about multiplying and dividing. So just to be clear, to put your SGP denominators on the same relative scale, choose the category with the largest numeric value, then divide each stat categories raw SGP denominator by that largest raw SGP denominator.

The largest numeric denominator is typically RBI for the hitting categories (the 16.30 from above is the largest SGP denominator) and strikeouts for pitching.

For the rest of this post I will be using this calculation of relative SGP denominators and NOT the way suggested in Winning Fantasy Baseball.

My NFBC Relative Versus Winning Fantasy Baseball’s 12-team Relative

Using the method described above, I calculated the relative denominators for Larry Schechter’s 12-team suggestions and my 2015 NFBC findings. Here are the results:

WINNING_FANTASY_BASEBALL

First look at the white lines. These give me that queasy feeling I was describing earlier. He’s saying 5.93 HR for a 12-team league? And I came up with 8.43? That’s 2.5 HR difference. How can these suggestions even be in the same ballpark?

Now look at the yellow-shaded lines. After everything is put on the same scale things look a lot more reasonable. When you look at all items on a relative scale, you can see many of the categories are strikingly similar (BA, R, RBI, SB, K, SV), but still show small variations. There is some variance in the other categories, but things don’t look as stark as with the raw denominators. This supports our beliefs about SGP being able to “tailor” to our league tendencies and preferences, but still leaves me feeling a lot more comfortable that my denominators are in fact closer to Larry Schechter’s than it appears on the surface.

Right around this time I’m starting to feel more comfortable with my analysis. But I’m also very curious about what happens if I start looking at SGP denominators from other sources. So I set out to find as many sources as I could find.

NOTE: After publishing this article, it came to my attention that there’s a typo in Winning Fantasy Baseball that makes this last segment somewhat less relevant. I’ve elected to keep it in despite this.

Other SGP Denominator Sources

The reliable sources I was able to locate for this analysis are:

Not bad. I was able to scrape up 13 different resources for comparison. And I threw in the average of those 13 resources as my 14th.

Here’s the Raw SGP Data

You can see things are all over the map. You can see general patterns, but the data fluctuates wildly. Some of the raw SGP denominators are almost double others. For example, Larry Schechter’s 12-team HR denominator is 5.93 while Razzball’s 2012 article calculated a 10.40!

And Here’s the Relative SGP Data

Continue reading “How to Analyze SGP Denominators from Different Sources”

An Important Lesson and How to Resolve VLOOKUP Errors

Let me come clean. I screwed up. And it likely will cause you to see errors in your spreadsheets. That’s the whole reason for this post.

Having trouble with VLOOKUP error messages? This post should help.

What Happened?

While this post is going to address a very important topic (resolving VLOOKUP errors), there wasn’t much of a need for this until I came up with a new format for the Player ID Map. The intent was to make the Player ID Map easily updatable. I hate having to lookup the IDs, birth dates, and handedness of all the new players.

And it’s always bothered me that there was no easy way for you to get updated Player ID information.

Let’s be honest. It’s a pain in the ass. Especially this time of year when players are switching teams every day and minor league players we haven’t had to deal with in the past are now projected to reach the big leagues this season. It’s tedious to keep teams up-to-date and to add these new players.

I needed to find a way to improve this process and to make everyone’s lives a little easier.

The Solution

The solution was to make the Player ID Map available in an online CSV file. One you connect that online file to your Excel spreadsheet, you simply have to right-click on the Player ID Map and hit “Refresh”. You will instantly get any update I’ve made.

Sounds amazing, right?

Major leaguers  have a purely numeric Fangraphs ID while minor leaguers have text in their ID.
Major leaguers have a purely numeric ID while minor leaguers have text in their ID.

The Problem

The fly in the ointment happens to be the way Fangraphs structures their player IDs. Major leaguers, like Jose Abreu, have a purely numeric ID. Whereas minor leaguers that have not reach the big leagues, like Yoan Moncada, have the text “sa” in front of a string of numbers.

The unintended consequence of importing the Player ID Map file is that because some IDs contain text, Excel will treat the ENTIRE imported column as text.

The problem is that reports you download from Fangraphs and then open in Excel treat the player ID column as numeric values.

Warning… It’s About to Get Technical

If you’re fine with the old Player ID Map and the fact that it doesn’t get updated very often, you don’t have to use the new one. The old one can be downloaded here and will still be updated periodically. You can stop reading this post and save yourself some sanity.

But if a little complication doesn’t scare you off and you see the value in being able to refresh the Player ID Map and get regular updates… Keep reading.

Text and Numbers Are Treated Differently

Excel and most other computer applications treat text and numbers differently. And this is a common problem with VLOOKUPS. So the number “15676” is not the same as a text string of “15676”. So in our VLOOKUPS, we need to make sure we are comparing numbers to numbers and text to text.

Consider the Error Message

The first step in resolving a VLOOKUP problem is to understand the error message you’re seeing.

The “#N/A” error is the most common VLOOKUP error. And it essentially means that a match was not found during the lookup.

There are two main reasons a match would not be found:

  1. The item (player ID) doesn’t exist where you told Excel to look for it
  2. Or you told Excel to look for the wrong data type (look for a text value in a list of numbers, or vice versa)

These are the downloaded Steamer Projections. Abreu's ID is the there. It's in the first column. Why isn't the VLOOKUP finding this???
Abreu’s ID is the there. It’s in the first column. Why isn’t the VLOOKUP finding this???

You can easily test the first error by manually performing the search yourself. Let’s walk through a hypothetical example with Jose Abreu. He’s a well known player. He’ll surely be in the Steamer projections I’ve downloaded.

I see from the data that Abreu’s Fangraphs ID is 15676. If I trace that through into the Steamer Hitter projections, I am able to locate Abreu. So why isn’t the VLOOKUP finding the same match?

Continue reading “An Important Lesson and How to Resolve VLOOKUP Errors”

How to Add Average Draft Position Info to Your Spreadsheet

I think you’re gonna like this one.

In this post I’ll show you how to link live average draft position information from the web into your draft spreadsheet. Every time you open your rankings file it will pull down updated ADP information. Bam!

How We’re Going To Do This

We will use a powerful feature of Excel called web querying to pull in the ADP information aggregated by FantasyPros.com (please note, I’m an affiliate of Fantasy Pros). The web query will suck up that table of ADP information and bring it directly into Excel for us to then VLOOKUP into our existing “Hitter Ranks” and “Pitcher Ranks” tabs.

Fantasy Pros has the best ADP information I've found on the web. They have the most sources in one place and it appears to be updated regularly.
Fantasy Pros has the best ADP information I’ve found on the web. They have the most sources in one place and it appears to be updated regularly.

Assumptions

I am assuming that you’ve followed my Standings Gain Points or Points-League Ranking series and are already starting with a spreadsheet that is based off one of those (you don’t have to have those exact spreadsheets, but something similar).

Excel Functions and Concepts Used in this Post

Web Query

As you can probably imagine, the power of the web query is that it automatically updates the data in your Excel file without you having to do ANYTHING after the initial setup.

Web queries are created from the “Data” tab on the Excel Ribbon, under the “Get External Data” icon grouping. There are several ways to get data from outside sources into Excel, we will be using the “From Web” button.

GET_EXTERNAL_DATA

One “weakness” I have found in web queries is that they cannot work with “tables” in Excel. You cannot pull a web query in as the data of a table. If you’re a big follower of this site you know that’s a bit of an issue for me because I use tables all the time. Thankfully this doesn’t prevent us from doing things, I just point it out because you might wonder why I set things up the way I do in the instructions below.

Find

The FIND function searches within a specified cell for a string of text that you provide. If the FIND function locates the string, it will return the character position where the string starts at.

I know, you’re thinking “What the heck does that even mean?”. Here’s an example. Let’s say we have the text “Mike Trout (LAA)” in a cell and every player in our whole spreadsheet follows that format. If we want to pull out each player’s team we will need to start by figuring out where the team name starts in that cell. And we can’t just say it will always start at the 13th character each time when we have players like this hanging around MLB.

Instead we can use the FIND formula to intelligently determine where that opening parenthesis is for each player (it starts at 12 for Trout and 23 for Salty).

This formula requires two inputs:

FIND(Find_text, Within_text)

FIND

  1. Find_text – This is the string of text you are searching for and keep in mind it is case-sensitive. You would wrap the string you are searching for in quotation marks. So in our example above, to look for the opening parenthesis you would enter “(” here. Or if you’re trying to be slightly more precise, you could enter ” (“, a space before the parenthesis.

  2. Within_text – This is the text you want to search WITHIN. This can be a cell number.

Left

The LEFT function gives you the leftmost number of characters in a text string. You also get to specify the number of characters to specify.

For example, if you have a text string of “Mike Trout (LAA)” and you ask for the 10 leftmost characters in that string, you would get “Mike Trout” back.

This formula requires two inputs:

LEFT(Text, Num_chars)

LEFT_FUNCTION

  1. Text – This is the text string you want the leftmost characters from.
  2. Num_chars – This is the number of characters you want from the string. This can be a hard entered number (e.g. 10) or it can be a formula itself that results in a number.

Combining Functions Together

We can do something pretty powerful by combining the FIND and LEFT functions together. I’ve been hinting at it with this “Mike Trout (LAA)” example. Recall from above that the LEFT function wants to know our text string (“Mike Trout (LAA)”) and the number of characters on the left to pull from that string.

Assume that cell B2 has a value of “Mike Trout (LAA)”. Instead of using this formula:

LEFT(B2, 10)

We can use this:

LEFT(B2, FIND(" (",B2)-1)

The FIND(" (",B2)-1 part of the formula returns a 10 (if you don’t subtract the one it returns an 11), and “Mike Trout” has 10 characters in it (including the space). By using this combination of functions we don’t have to type in a “10” for Mike Trout and a “21” for Saltalamacchia.

Important Prerequisite

Before you’re able to proceed with the instructions below you must make sure the PLAYERIDMAP in the file you’re working with was updated after February 21st, 2015. I added a column to the Player ID Map called “FANTPROSNAME” that is necessary for the steps below to work.

Instructions for updating your PLAYERIDMAP can be found here. Completing the update should only take five minutes or so.

Step-by-Step Instructions

Continue reading “How to Add Average Draft Position Info to Your Spreadsheet”

How To Calculate Custom Rankings for a Points League: Part 1 – Download Projection Data and Player ID Map

Welcome to the first part of a series in which we’ll go step-by-step through the process of using Microsoft Excel to calculate your own rankings for a fantasy baseball points league (as opposed to rotisserie or head-to-head rotisserie).

Whether you’re in a standard points league at a major site like ESPN or a more advanced Ottoneu league at Fangraphs, this process will help you develop customized rankings for your league.  These instructions can be used for a season-long points league or a weekly head-to-head points league.

If you’re looking for info on how to rank players for a roto league, look here.

In this first part of the series we’ll start a new Excel file and download projection information.

Why I Created This Series

Points leagues seem to be like fingerprints and snow flakes. Each one is a little different than the others. I’m a big believer that in order to be a strong fantasy player, you need to create your own rankings and dollar value calculations that are tailored specifically to the league(s) you play in.

I’ve also felt that nobody takes the time to explain exactly how to create your own rankings. If you look hard enough you might find an article that gives a quick bullet point list.  Maybe something like:

  • Download projections
  • Multiply projections by your point system
  • Adjust for replacement level
  • You’re done!

I’m going to be a little more thorough than that.

In Part 1

In this first part of the series we’ll download hitter and pitcher projections, take a look at and download player ID information, and bring all of this information into one Excel file.

ABOUT THESE INSTRUCTIONS

  • The projections used in this series are the Steamer 2015 preseason projections from Fangraphs.  If you see projections that you disagree with or that appear unusual, it’s likely because I began writing this series in December 2014, still early in the off-season.
  • For optimal results, you will want to be on Excel 2007 or higher.  Some of the features used were not in existence in older versions.
  • I use Excel 2013 for the screenshots included in the instructions.  There may be some subtle differences between Excel 2007, 2010, and 2013.
  • I can’t guarantee that all of formulas used in this series will work in Excel for Mac computers.  I apologize for this.  I don’t understand why Excel operates differently and has different features on different platforms.

Where To Get Projections

There are many solid projection systems available for download.  Some very fine projections are available at membership sites like Baseball Prospectus or Baseball HQ.

But if you’re like me, when I started out on the adventure of calculating my own rankings, I wasn’t looking to pay for something I wasn’t sure I’d be able to translate into fantasy success.  It’s great to have accurate projections, but how do you use them if you can’t take the next step to rank and value those projections?

For that reason, I’m partial to the Steamer projections.

They’re available in easy-to-use Excel downloads (specifically CSV) at Fangraphs. There are also daily rest-of-season updates, meaning on any day you can see the projections for the remainder of the season for any player.  Steamer does a good job of projecting playing time (if a player gets hurt, they try to estimate the effect on playing time).

And they’re free.

Use Whatever Projection System You Prefer

I’ll be using Steamer in this example.  But you can use the system of your choice.  Just try to pick a system that uses some form of player ID system.

What is a Player ID?

Just like you and I are identified by Social Security Numbers or employee IDs (at work), most of your major fantasy or MLB websites use some form of an ID number that is unique to each player.

Using an ID is a more reliable way of identifying a player than a simple name.  Two players can have the exact same name (think Chris Young and Alex Gonzalez) which could cause big problems when ranking players.

And players can go by different name variations (Mike and Michael, Jon and Jonathan, JP and J.P., AJ and A.J.) or even change their name (Mike to Giancarlo Stanton, Fausto Carmona to Roberto Hernandez).

Here’s a quick look at some player IDs for various systems:

Player ID Source Mike Trout Clayton Kershaw Giancarlo Stanton
Baseball Reference troutmi01 kershcl01 stantmi03
Fangraphs 10155 2036 4949
MLB 545361 477132 519317
CBS 1739608 1221725 1630093
ESPN 30836 28963 30583

If you’re wondering how to determine someone’s player ID, visit their player page on a particular website.  You can usually find the player ID in that web page’s URL.  For example, here’s Mike Trout’s MLB.com player page:

MIKE_TROUT_PLAYERID

In looking at that table above, you can see here that there is not one universal numbering system.

To alleviate this problem, I maintain a “Player ID Map” (click here to download in Excel).  The Player ID Map lists out all “fantasy-relevant” players and their ID for each of the major systems (Fangraphs, Baseball Reference, Baseball Prospectus, Yahoo, ESPN, etc.).

PlayerIDImage

I stumbled across the concept of the player map from Tim Blaker at Crunchtimebaseball.com and tailored it to meet my needs.  This provided me with an excellent starting point.  Tim maintains his own version and updates his more frequently than I do.  I only maintain my own because I’ve wanted to add some new columns.

On this site I will typically work with the Baseball Reference ID.  I like those IDs more than the others because I can look at an ID and usually determine who the player is (troutmi01 is Mike Trout).  Most other sites use a straight ID number that has no inherent meaning (10155 or 545361).

If you’re familiar with Excel and using VLOOKUPs, Player IDs are the item we’ll be matching upon to start pulling information around our Excel rankings file.  If you have no idea what I just said, don’t worry.  We’ll get there soon.

STEP-BY-STEP INSTRUCTIONS

Continue reading “How To Calculate Custom Rankings for a Points League: Part 1 – Download Projection Data and Player ID Map”

How Does a Player’s Age Affect Draft Return?

A few weeks back I took a closer look and analyzed the last five years of preseason Steamer projections (what I’m using as my best approximation of the “draft value” of each player heading into the season) and compared them to the actual end of season dollar values earned by those same players.

One of the glaring omissions in that article was some kind of analysis by age.  Are there certain age groups that might be undervalued?  Better yet, are there certain age groups of hitters we can take advantage of and a separate age group of pitchers we can jump on?

If we are trying to decide between a $20 pitcher who’s 23 years old or a $20 pitcher who’s 33 years old, who should we choose?

Quick Reminders

I’d highly recommend reading the first article that started me down this road.  There’s a greater explanation of the approach used.  But for a quick reminder… the dollar values are based on a standard 12-team league using traditional rosters (2 catchers, 14 hitters, 9 pitchers) and the standings gain points approach.

I also calculate return “including losses” and “without losses”.  The best way to think about this is with a pitcher suffering a terrible injury in the first month of the season.  Being injured that early, regardless of how good the pitcher is, will result in negative earnings.  But the “benefit” of an injured pitcher is that you can immediately drop them and not suffer any of those negative earnings.

The flip side of that coin is with a struggling pitcher.  You may decide to stick with a struggling pitcher for weeks or months, hoping for them to turn it around.  In this scenario you are saddled with many of the negative earnings for that player.  So the actual “return” on players lies somewhere between the “including losses” and “without losses” results.

Draft Results By Player Age

Take a look at the “Including Losses” and “Without Losses” charts below.  Does anything jump out at you?

RETURN_BY_AGE_WITH_LOSSES Continue reading “How Does a Player’s Age Affect Draft Return?”

Analyzing the Last Five Years of Rotisserie Baseball Drafts

How many of the top hitters and pitchers at the end of the year were actually drafted? How many of the top hitters and pitchers were not drafted and were picked up during the season?  Were hitters or pitchers drafted more accurately?  What is the dollar value earned by the players that were picked up during the season?  Is there a position of hitter that’s more reliable than other positions?

Have you ever asked yourself draft analysis questions like these?

What follows is a five year analysis (with colorful graphs and an enormous Excel file!) of how accurately our projections in the preseason depict what has actually happened at the end of the season. How well we drafted.  What positions yield the best returns.  What positions offer the most free loot.  And more.

Assumptions You Should Know

A number of the graphs depend on dollar value earnings for the “top 168” projected hitters or “top 108” projected pitchers.  The dollar values are calculated using the approach documented in “Using Standings Gain Points to Rank and Value Fantasy Baseball Players” assuming a 12-team league, $260 team budget, 14 hitters (C, C, 1B, 2B, SS, 3B, CI, MI, OF, OF, OF, OF, OF, UTIL), 9 pitchers, and a 70%-30% hitter-to-pitcher allocation.  That’s a total of 168 hitters and 108 pitchers.

These top projected players in the preseason were determined using Steamer’s preseason projections for that season (I downloaded the historical projections here).

I suppose using ADP results or expert rankings from the given year might give a better picture of the players that were actually drafted, but then you get into the question of what’s good ADP data, where to get it, what experts to use, league differences, lineup differences, etc.

To Be Clear…  The Goal of this Study

The goal of this is not to measure the accuracy of particular experts.  It is to determine which positions can we draft and get the most return on our investment.  To some extent this is a review of Steamer’s accuracy, but that’s also not my intent.  It’s my understanding (tell me if I’m wrong) that there are not significant differences between the top projections systems.  So whether we were looking at PECOTA, Steamer, or Marcel projections, we would see similar results.

How Much of a Return Do We Get For Drafting HItters vs. Pitchers?

People have long been telling us to, “Load up on hitters early in the draft”.

“Don’t overspend on pitching.”

“Wait on pitching until most teams already have one.”

I’ve always heard these things.  They sounded right.  But I can’t say I’ve ever seen the data to support it.

In looking at the chart below it is very clear that we are much better at identifying the top hitters than the top pitchers.  The top 168 hitters in the preseason provide about 70% of the dollars earned at the end of the season.  For pitchers, it’s more in the neighborhood of 40%.

With results like that it’s very easy to see why the hitter-pitcher split is not 50-50.

Hitters are safer investments than pitchers.  We’ve always been told this, but now you can see it.  And things have not changed in the new era of pitching that we’ve been seeing the last few years.  If anything, the gap seems to have widened.

Hitter-Pitcher-Draft-Returns-With-Losses
In a draft and hold environment, the return on investment for drafting hitters fluctuates between 65% and 80%. The return on pitchers is much lower, falling roughly between 30% and 50%.

Continue reading “Analyzing the Last Five Years of Rotisserie Baseball Drafts”

The Difficulty In Aggregating Projections

Now that we’ve established that we can benefit from combining multiple projection models into one, let’s take a look at the challenges this presents.

I’ll also give brief explanations of how you can work around these challenges in Excel.  At the end I’ll discuss an Excel template I’m working on that will do these calculations for you automatically and how you can get your hands on it.

I love Your Feedback

If you’re a SFBB Insider you might recall that after you sign up, the very first e-mail I send you asks you to reply with any fantasy baseball topics you’d like to know more about or difficulties you’re having (if you’re not, you can register here.  I like to think it’s worth your while).

Insider

I Read All Of Those Responses

I’ve been fortunate enough to have nearly 500 people register, and I read every single response that comes in from that question.  One of the most frequent areas of interest is how to average, or aggregate, multiple sets of projections into one usable set of information.

More Difficult Than I Originally Thought

These requests started to roll in during the off-season, and I even replied to several people saying that I thought this was going to be easy and that I’d have guidance coming out soon on how to do this.

… And here I sit months later having never written on the topic yet.

In theory, averaging a set of three numbers in Excel is easy.  If one system says 25 HR, one says 30 HR, and another says 35 HR, Excel’s AVERAGE formula can easily respond with the average of 30.

But I quickly ran into some big problems that greatly complicated things.

Problem 1 – Lining Projections Up To Do The Averages

In order to aggregate multiple projection systems into one, we need a method of “lining up” the projections from one system with those of another system.  Perhaps Giancarlo Stanton is projected to hit 20 HR the rest of the season by Steamer and 22 HR by PECOTA.

Giancarlo_Stanton_ROS
I made this information up just to illustrate the concept of “lining up” different projections.

We can use formulas in Excel (e.g. VLOOKUP) to pull Stanton’s Steamer projection and place it next to his PECOTA projection.  But you can run into some complications in doing this.  What if one projection system lists him as “Stanton, Giancarlo” and the other as “Giancarlo Stanton”.

Using names to pull data also opens you up to inconsistencies in the name being used.  Is it Jonathan Singleton or Jon Singleton?  AJ Burnett or A.J. Burnett?

If you have taken on the challenge of creating your own rankings, you know that we’ve dealt with this problem before, but on a smaller scale.  In my rankings spreadsheets I use a consistent playerID to pull information between the different tabs.  I prefer to use the Baseball-Reference playerIDs because you can tell who a player is (Stanton is “stantmi03” because there were two other Mike Stanton’s before him).

But seemingly every major baseball site has their own player ID system.  Fangraphs says Stanton is “4949”, Baseball Prospectus uses “57556”, ESPN says “30583”, etc.

This is why I maintain the SFBB player ID map Excel file.  The map allows for this translation or “lining up” to happen.  It’s the bridge that can easily help you take Stanton’s projection from one system and place it next to his projection from another.  Giancarlo_Stanton_PlayerID

Problem 2 – Players Not Projected In All Systems

Continue reading “The Difficulty In Aggregating Projections”

Should You Combine Multiple Projection Systems Into One?

Should I use this projection system or that one?  Why mess around with the second best system if you can easily determine the best, right?

If you search the web, you can locate previous studies that review the accuracy of baseball’s many projection models.

I Don’t Have Time To Read All That.  Just Tell Me what They Say.

Understood.  Here’s my summary:

  • There area lot of different approaches to projecting stats (Marcel, Steamer, Zips, Oliver,PECOTA, etc.)
    • Basic three year weighted average with regression to league average
    • More than three year weighted averages incorporating more advanced component metrics
    • Crowd sourcing
    • Aging curves
    • Similar player modelling
  • No single projection system is consistently better than the others in all the stat categories we care about for fantasy baseball
  • The most accurate projection model changes from year-to-year
  • But there are some that consistently perform well
  • Some systems do well in projecting offensive statistics
  • Some are better at pitching

What Is Also True

A lot of research has been done on the effectiveness of combining or “aggregating” different projections or forecasts into one.  This research was not done with only fantasy baseball in mind, but we can take advantage of it.  Here’s one very interesting article on the topic (it’s from a website named “forecastingprinciples.com” and is a PDF of a study from the Wharton School of Business at Penn, it has to be legit, right?).

The thinking behind aggregating projections is that the wisdom of many intelligent people looking over a lot of information can lead to better results than just one isolated model for projecting future results.  When you combine all of this together you’ll naturally be removing the outliers from the individual models, but hopefully you’re also improving the accuracy as a whole.

The Actual Results

It may not be appropriate to boil a 15 page research paper into a couple of sentences.  But I’m going to do it anyway!  Here’s what the PDF linked above concludes on the evidence on the value of combining forecasts: Continue reading “Should You Combine Multiple Projection Systems Into One?”