2017 Average Standings and SGP for the 2018 Season

In order to prepare for the upcoming season, we need some important information from last year. In this post, I’ll share with you the average standings for 12- and 15-team NFBC leagues, and the average ERA, WHIP, and batting average in those leagues. With this information, you should have everything you need to get started on your SGP rankings for the 2018 season.

Where Do I Get This Data From?

The last several years, I’ve participated in the NFBC’s Draft Champions competition. By participating in such a league, a user gets access to see the standings to all the various NFBC competitions.

As far as I can tell, it seems like you need to be a registered NFBC user to see the standings data. If you happen to be one (and you’re logged into the NFBC site), you can see standings data for the various contests at these links:

I take this data and manipulate it in Excel to calculate average standings across all the leagues using the process I describe here.

If you are not an NFBC user, you can see some of the historic analysis I’ve compiled from 2012 through 2016 here.

With that in mind, let’s take a look at the 2017 results.

12-team League Average Standings

Across the 149 Online Championship leagues hosted by NFBC, the average standings for first through twelfth are shown below. Note, the 1,156 RBI is the average of all teams that finished in first place in RBI. It is NOT the average of what league winners averaged in the RBI category. The league winner in RBI could have finished in 7th place overall, but is included in the 1,156 average figure.

RK PTS AVG R HR RBI SB ERA WHIP W K SV
1 12 .2788 1,178 365 1,156 174 3.480 1.171 107 1,522 105
2 11 .2750 1,144 349 1,121 159 3.638 1.204 102 1,469 97
3 10 .2727 1,125 340 1,098 149 3.740 1.222 98 1,435 90
4 9 .2706 1,108 332 1,080 142 3.827 1.238 96 1,403 85
5 8 .2688 1,091 324 1,061 135 3.891 1.250 93 1,372 81
6 7 .2674 1,078 317 1,045 129 3.960 1.263 90 1,341 76
7 6 .2660 1,064 310 1,027 123 4.027 1.276 88 1,313 70
8 5 .2643 1,048 303 1,011 117 4.100 1.287 85 1,282 65
9 4 .2626 1,029 296 992 111 4.171 1.300 82 1,245 59
10 3 .2609 1,010 288 972 105 4.263 1.316 78 1,209 51
11 2 .2588 983 277 948 96 4.375 1.336 73 1,150 40
12 1 .2543 937 258 896 80 4.557 1.366 66 1,057 26

12-team League SGP Factors

Using the information from the league average standings, the raw and relative SGP factors are as follows:

SGP TYPE AVG R HR RBI SB ERA WHIP W K SV
Raw 0.0019 19.060 8.526 20.635 7.405 (0.086) (0.0160) 3.288 37.244 6.461
Relative 0.00009 0.924 0.413 1.000 0.359 (0.0023) (0.0004) 0.0883 1.000 0.174

Historic Online Championship (12-team League) SGP Factors

Here are the Online Championship hitting categories:

Year Type BA R HR RBI SB
2012 Raw 0.00220 19.197 8.016 20.675 8.270
2013 Raw 0.00193 19.265 7.537 20.685 8.603
2014 Raw 0.00197 18.843 7.481 19.639 7.900
2015 Raw 0.00177 19.920 8.429 19.549 7.591
2016 Raw 0.00182 19.721 8.797 21.527 8.508
2017 Raw 0.00193 19.060 8.526 20.635 7.405
2012 Relative 0.00011 0.92848 0.38769 1.000 0.40001
2013 Relative 0.00009 0.93136 0.36435 1.000 0.41589
2014 Relative 0.00010 0.95950 0.38094 1.000 0.40224
2015 Relative 0.00009 1.01898 0.43115 1.000 0.38828
2016 Relative 0.00008 0.91607 0.40863 1.000 0.39520
2017 Relative 0.00009 0.92366 0.41320 1.000 0.35885

Here are the Online Championship pitching categories:

Year Type ERA WHIP W K SV
2012 Raw (0.07840) (0.01320) 3.253 30.968 7.184
2013 Raw (0.07623) (0.01472) 2.899 32.811 7.038
2014 Raw (0.06880) (0.01280) 2.999 31.181 6.964
2015 Raw (0.07876) (0.01464) 2.926 35.163 7.210
2016 Raw (0.08042) (0.01529) 3.184 34.212 6.842
2017 Raw (0.08587) (0.01548) 3.288 37.244 6.461
2012 Relative (0.00253) (0.00043) 0.10503 1.000 0.23197
2013 Relative (0.00232) (0.00045) 0.08837 1.000 0.21452
2014 Relative (0.00214) (0.00040) 0.09320 1.000 0.21640
2015 Relative (0.00224) (0.00042) 0.08321 1.000 0.20505
2016 Relative (0.00235) (0.00045) 0.09307 1.000 0.19998
2017 Relative (0.00231) (0.00042) 0.08827 1.000 0.17348

15-team League Average Standings

The NFBC offers two different types of 15-team leagues. The “Main Event” is a closer approximation to your typical home league, in that it allows for in season player pickups from the waiver wire. The Draft Championship does NOT allow in-season moves, but you do draft a 50-player team in order to build a deeper roster that might get you through the season without the ability to add anyone.

Continue reading “2017 Average Standings and SGP for the 2018 Season”

Standings Gain Points for NFBC Leagues

In the post that follows, I’ll share standings gain points (SGP) factors for the NFBC Main Event, NFBC Draft Championship, and NFBC Online Championship for each of the last five years (2012-2016). But I’ve got to lay some groundwork before we get there…

Raw vs. Relative

While the discussion is a bit lengthy, I think this article discussing “raw” and “relative” SGP contains one of the most significant realizations I’ve had in fantasy baseball.

The quick and dirty explanation of this realization is that it is not only the raw SGP factors (or denominators) that drive player value calculations. The relationship, or relative value, between the SGP factors is also meaningful. Not only that, but looking exclusively at raw factors can be misleading, as it is difficult to see these relationships.

To illustrate, here are two example sets of raw SGP factors for a league:

League BA R HR RBI SB
2013 15-team NFBC Main Event 0.00161 13.751 5.533 15.115 6.228
2016 15-team NFBC Main Event 0.00150 15.366 6.561 16.838 6.375

I refer to these as raw factors because they’re calculated using the standard process prescribed by SGP. A calculation is made for each scoring category and those numbers are then fed into the process that’s used to rank or assign dollar values to players.

Looking again at the table of raw data above, you might think, “Wow, what happened in the last three years that caused those significant changes in the SGP factors?”

You might even start spewing some narrative about the changing landscape of baseball, the rise in strikeouts, and the power surge MLB experienced last season.

But before you start that process, let’s take a look at those same sets of SGP factors, after they’ve been converted into relative form:

League BA R HR RBI SB
2013 15-team NFBC Main Event 0.00011 0.90976 0.36609 1.00000 0.41202
2016 15-team NFBC Main Event 0.00009 0.91256 0.38963 1.00000 0.37862

The numbers still fluctuate. And if you run the math, from 2013 to 2016 the categories changed about 10%, on average, in both the raw and relative calculations. But seeing the factors in relative form really gives me a lot more confidence in my calculations.

I was always wondering if I screwed up my calculations before making this realization. “Could RBI really have changed that much?”

To be clear, I did not develop this way of looking at the numbers. I made the realization after reading “Winning Fantasy Baseball” by Larry Schechter. Although I didn’t invent this approach, I continue to share it because I think a lot of folks are confused by the raw numbers and this confusion leads to decreased confidence in the SGP approach.

How to Calculate Relative SGP

Continue reading “Standings Gain Points for NFBC Leagues”

Start Preparing for the 2017 Season!

It’s time! Are you getting the itch to start thinking about fantasy baseball again? Are ready to take on a new challenge this year and calculate your own rankings or create your own projections? All spreadsheet templates have been updated for the upcoming 2017 season. Take a look at the available books and tools below.

Title Description
Bundle Image The Projecting X 2.0 Bundle
***UPDATED for 2017***

The Projecting X 2.0 Bundle comes with Mike Podhorzer’s instructional guide to creating your own baseball projections, as well as an accompanying Excel template to help save you hours and hours of time as you work through the projection process.

The Projecting X 2.0 Excel Template Only
***UPDATED for 2017***

(NOTE: the Excel template requires you to enter certain formulas from the book, Projecting X 2.0. If you purchased the bundle prior to the 2016 season, this is being offered to save you the time of having to manually update the player names, teams, and positions in the spreadsheet in order to start projecting the 2017 season.)

AGGREGATOR Projection Aggregator
***UPDATED for 2017***

An easy-to-use Excel spreadsheet that can combine (or average) up to three different projection sets. The aggregator can use just about any well known projection set you can find on the web (if you find one that doesn’t work, let me know!). Simply download your favorite projection sets, fill out some settings, and you’re done. No complicated formulas or VLOOKUPS for you to add.

Using Standings Gain Points to Rank and Value Fantasy Baseball Players

Ever wanted to create your own rotisserie rankings? This is my instructional guide written specifically to show you how to create customized rotisserie player rankings, dollar values, and inflation dollar values, in Microsoft Excel, tailored to your own league. No more downloading rankings from the web, hoping they apply to your unique league. 10, 12, or 15-team league? $260 or $300 budget? AL-only or mixed league? 10 hitters or 14? It doesn’t matter. This book will guide you through the process of developing rankings for just about any kind of rotisserie league.

How to Rank and Value Fantasy Baseball Players for Points Leagues

My step-by-step guide to building custom rankings, dollar values, and inflation dollar values, in Microsoft Excel, for your points league. This book will guide you through the process of developing rankings for just about any point-based scoring format.

How to Analyze SGP Denominators from Different Sources

Do you know if the SGP calculations you’ve done for your league are accurate?

Are you concerned that your home run SGP denominator is 8.87 and Larry Schechter’s book Winning Fantasy Baseball suggests using 5.93 for a 12-team league? Or that your RBI calculation shows 22.31 and the 12-team NFBC history I just calculated shows 19.55?

What does this all mean? Will your rankings be accurate? How can they be when your denominators seem significantly different than those you see elsewhere?

Calm Down, These Numbers Are More Consistent Than You Realize

I know. You’re wondering how on Earth I can say that. How can a HR denominator of 8.87 be consistent with one of 5.93?

To be honest, I’ve had those same fears about SGP. I feel so scientific and strategic by calculating SGP. And then I look at my denominators in comparison to what I see published elsewhere and that confidence evaporates and is replaced with doubt.

In this post I’m going to share an important realization I just had about SGP (yep, I’m still learning too), show you how to properly compare your SGP denominators to different resources, and demonstrate that the dollar values calculated by different sets of denominators are more similar than you would believe. When we’re done here, I think we’ll all feel a lot more comfortable about things.

Story Time

This story starts with me calculating the SGP for the last three seasons of NFBC leagues (which make their standings information publicly available).

I read Winning Fantasy Baseball a couple years ago (if you haven’t read it and you’re about to read 2,500 words on SGP denominators, you really should get the book), and I vaguely remembered the book giving SGP denominators for a variety of league types. I wanted to verify that my findings were similar to Schechter’s.

Here’s what I found:

Source BA R HR RBI SB
2015 12-team NFBC Online Championship 0.00180 19.92 8.43 19.55 7.59
Winning Fantasy Baseball 12-team League 0.00165 15.52 5.93 16.30 5.93

Damn. WTF does this mean? Those don’t look close to me. Did I do something wrong?

A Very Important Point

As I looked more closely at the book, I noticed I missed a very important point the first time I read it. Next to each number, Schechter had calculated a “relative SGP value”.

SGP Type BA R HR RBI SB
Raw SGP Denominator 0.00165 15.52 5.93 16.30 5.93
Relative SGP Denominator n/a 1.05 2.75 1.00 2.75

And here’s the important point Schechter makes about these calculations:

… when you’re trying to adjust SGPs for leagues of various sizes, it’s important to realize that the raw value of the SGP isn’t very important, but rather the ratio of the values.

~ Larry Schechter, Winning Fantasy Baseball

Mine Is Bigger Than Yours Is

I glossed over that red bolded sentence on previous reads (because it’s not bolded red in the book…). But this small statement buried in the middle of the 350-page book is exactly the point I needed for the self-doubt I was experiencing.

So in order to hopefully save you the same trouble, take note! You can’t compare your SGP denominators to someone else’s. You have to convert them to a relative scale first.

Raw Versus Relative – An Example

Let’s focus in on just the HR and RBI stats from the table above.

SGP Type HR RBI
Raw SGP Denominator 5.93 16.30
Relative SGP Denominator 2.75 1.00

If it takes 16.30 RBI and 5.93 homers to move up the standings, this essentially means that one home run is 2.75 times more important than one RBI (home runs are more scarce, so getting one of those is more valuable than the more common commodity, RBI).

16.30 / 5.93 = 2.75

Do you remember working with fractions in elementary school? I liken this practice to that whole “lowest common denominator” charade we had to go through. Dropping the SGPs to a relative scale is like converting them to a lowest common denominator. If you leave the SGP factors grossed up at these high numbers (like 5.93 and 16.30), it’s more difficult to see the relationships you can see when they’ve been translated into the relative scale.

One More Math Concept

If you read Using Standings Gain Points to Rank and Value Fantasy Baseball Players or if you’re generally familiar with the SGP approach, you know that we would divide a player’s home run total by the home run “SGP denominator” to know how many SGP the player contributes due to his homers.

For example, if a player is projected by 30 home runs, an SGP denominator of 5.93 would indicate the player’s homers are worth 5.1 points in the standings (30/5.93=5.1). If the same player is projected for 83 RBI, an SGP denominator of 16.30 suggests the RBI are also worth 5.1 SGP (83/16.30=5.1). The 30 HR are worth the same as 83 RBI (5.1 SGP).

However, the way Larry Schechter has calculated his relative SGP would require you to multiply a player’s stats to achieve that same equality. For example, the 30 HR multiplied by 2.75 is 83 “points”. The 83 RBI multiplied by 1.00 is also 83 “points”. The 30 HR are worth the same as 83 RBI (83 relative SGP).

For Consistency, I Will Calculate Relative SGP Another Way

If you look back at the big bolded numbers above, Larry Schechter used the largest statistic (RBI for hitters and K for pitchers) as the numerator in his conversion. I will use it as the denominator.

5.93 / 16.30 = 0.364

I’m mostly doing this because everything I’ve written about SGP to this point tells you to DIVIDE BY THE SGP DENOMINATOR (heck, it’s called a denominator, meaning it’s on the bottom of the fraction). To now tell people to MULTIPLY BY THE RELATIVE SGP DENOMINATOR seems too confusing to me.

I’m sure I’ve confused the hell out of everyone at this point either way. And I apologize for this. But I think this topic is very important to understand. I’m giving it my best! Even if you’re confused, keep reading. I think this will all pull together very nicely in the end.

Going back to our example of a player with 30 HR and 83 RBI, if I divide by an SGP denominator of 0.364 I get that same 83 “points” (forgive the rounding), meaning the 30 HR are worth the same as the 83 RBI under this approach. So whether you use Schechter’s relative numerator and multiply or my relative denominator and divide, you get the same results.

How to Calculate “Relative” SGP Denominators

I’ve talked a lot about multiplying and dividing. So just to be clear, to put your SGP denominators on the same relative scale, choose the category with the largest numeric value, then divide each stat categories raw SGP denominator by that largest raw SGP denominator.

The largest numeric denominator is typically RBI for the hitting categories (the 16.30 from above is the largest SGP denominator) and strikeouts for pitching.

For the rest of this post I will be using this calculation of relative SGP denominators and NOT the way suggested in Winning Fantasy Baseball.

My NFBC Relative Versus Winning Fantasy Baseball’s 12-team Relative

Using the method described above, I calculated the relative denominators for Larry Schechter’s 12-team suggestions and my 2015 NFBC findings. Here are the results:

WINNING_FANTASY_BASEBALL

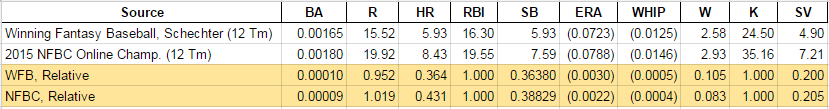
First look at the white lines. These give me that queasy feeling I was describing earlier. He’s saying 5.93 HR for a 12-team league? And I came up with 8.43? That’s 2.5 HR difference. How can these suggestions even be in the same ballpark?

Now look at the yellow-shaded lines. After everything is put on the same scale things look a lot more reasonable. When you look at all items on a relative scale, you can see many of the categories are strikingly similar (BA, R, RBI, SB, K, SV), but still show small variations. There is some variance in the other categories, but things don’t look as stark as with the raw denominators. This supports our beliefs about SGP being able to “tailor” to our league tendencies and preferences, but still leaves me feeling a lot more comfortable that my denominators are in fact closer to Larry Schechter’s than it appears on the surface.

Right around this time I’m starting to feel more comfortable with my analysis. But I’m also very curious about what happens if I start looking at SGP denominators from other sources. So I set out to find as many sources as I could find.

NOTE: After publishing this article, it came to my attention that there’s a typo in Winning Fantasy Baseball that makes this last segment somewhat less relevant. I’ve elected to keep it in despite this.

Other SGP Denominator Sources

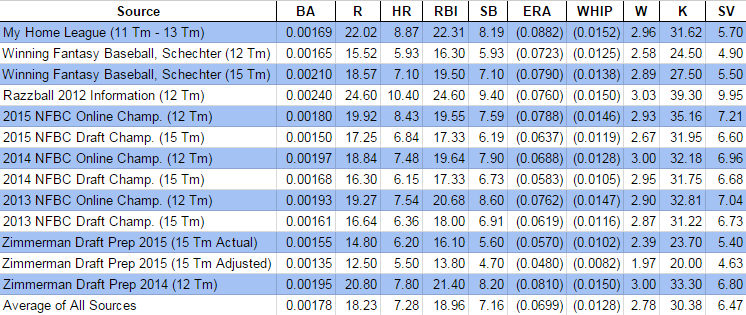
The reliable sources I was able to locate for this analysis are:

Not bad. I was able to scrape up 13 different resources for comparison. And I threw in the average of those 13 resources as my 14th.

Here’s the Raw SGP Data

You can see things are all over the map. You can see general patterns, but the data fluctuates wildly. Some of the raw SGP denominators are almost double others. For example, Larry Schechter’s 12-team HR denominator is 5.93 while Razzball’s 2012 article calculated a 10.40!

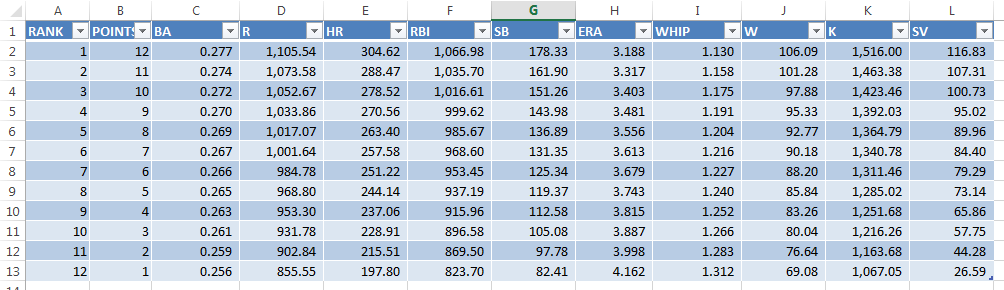
And Here’s the Relative SGP Data

Continue reading “How to Analyze SGP Denominators from Different Sources”

How to Get Reliable SGP Data

I’m an SGP guy. Standings gain points are what I first learned. The approach has been good to me. And it seems I’ve been fairly successful using the approach. But SGP has a weakness. It’s a big weakness that prevents a lot of fantasy baseball players from using the approach.

Where Can I Get Reliable SGP Data?

Where can I find historical SGP data??? This is one of the most common questions I get about the use of standings gain points. If you’re starting a new league, don’t have access to league history, or switched website providers, you’re screwed. You can’t really start using SGP. And let’s not even mention those of you that play in AL or NL-only leagues (I still don’t have an answer for that, sorry).

In this post I’ll share with you where and how you can get great quantities of actual league standings in competitive mixed leagues (again, sorry mono-leaguers, I would love to help you one day but I haven’t found out how yet).

I got the idea to do this by reading Jeff Zimmerman’s fantasy draft prep series in 2014 and 2015.

Where Can You Find Standings Information for Competitive Leagues?

I haven’t proven the theory yet, but I’m pretty certain you could write some kind of web scraping program to pull down the standings information for public Yahoo! and ESPN leagues. But who knows what the level of competition is in those? You would have to find a way to weed out the non-competitive leagues and teams to prevent those that draft and then never change their lineup the entire season from distorting the standings information.

NFBC_LOGO

Enter the National Fantasy Baseball Championship (NFBC)

The National Fantasy Baseball Championship (NFBC) is the industry leader in premium fantasy baseball leagues. Meaning leagues that people pay an entry fee to join in an effort to win prize money.

The fact that people are paying money to enter these leagues and that prize money is at stake is the best mechanism we could hope for to ensure competitiveness. The standings information will not be tainted by schleps that draft a team and abandon in after the first week of the season.

Not only that, but the NFBC also publishes final league standings by category and makes them available to anyone! This is an SGP jackpot.

Different Types of Leagues

The NFBC has several different competitions. The two most likely to be of value to us are the “Online” and “Draft Champions” leagues. These leagues have the most entrants, so we can reduce concerns over small sample sizes. Here’s a summary of the two league types and links to the standings information for them:

NFBC League Type Standings Links Description of League
Online Overall Standings
BA, R, HR, RBI, SB
ERA, WHIP, W, K, SV
  • Standard 5×5 roto categories
  • 12 teams
  • Online 30-round draft
  • Standard 23 player lineup (14 hitters, 9 pitchers, 7 bench spots)
  • Online drafts, February through April
  • Free agency FAAB bidding proccess
  • No trading
Draft Champions Overall Standings
BA, R, HR, RBI, SB
ERA, WHIP, W, K, SV
  • Standard 5×5 roto categories
  • 15 teams
  • Online 50-round slow draft
  • Standard 23 player lineup (14 hitters, 9 pitchers, 27 bench spots)
  • Online drafts, November through April
  • Draft and hold, no free agency
  • No trading

So the big differences to note are that the “Online” leagues have 12 teams and a 30 round draft. The “Draft Champions” leagues have 15 teams and have 50-round drafts because they don’t have free agency during the season. We’ll a look at this in future posts to see if it seems to affect things.

Now That We Have This Information, What Do We Do Next?

There were 125 leagues and 1,500 teams in the 2015 Online NFBC leagues and 192 leagues and 2,880 teams in the 2015 Draft Champions leagues.

That’s a lot of data. Is there a practical way to take all of that data and use it to calculate SGP factors? Of course!

You’re Boring Me and I Don’t Want to Do This Myself

NOTE: I’m about to go through instructions how to calculate the NFBC SGP numbers yourself, but if you just want my completed analysis, you can download them here:

I may not update this information every year into the future… So remember, the instructions below will remain so you can do this yourself!

Excel Functions Used in this Post

We’ll be using the SLOPE, IF, and AVERAGEIFS formulas to calculate SGP for the NFBC leagues.

SLOPE

You can read more about the SLOPE formula in a three part series I wrote about here, here, and here.

The short description is that the SLOPE function finds the line of best fit through a given set of data points. With our rotisserie standings data, the SLOPE formula essentially calculates the actual SGP factor or denominator. I’d highly suggest reading the three part series. Or at least Part I!

IF

The IF function checks to see if a condition is met. If the condition is met, the function returns one response. If the condition is not met, the function returns another response. One important fact to realize is that the responses you specify in the IF formula can be formulas. So if the condition you specify is met, you can have the cell use formula A. And if the condition you specify is not met, you can have the cell use formula B.

The function requires three inputs:

  • Logical_Test – This is typically a formula to be evaluated. An example might be “is cell C2 greater than cell D2”.
  • Value_If_True – This is the value to be shown or the formula to be evaluated if the Logical_Test is passed,.
  • Value_If_False – This is the value to be shown or the formula to be evaluated if the Logical_Test is failed.

AVERAGEIFS

The AVERAGEIFS formula will calculate the mean of groups of cells that meet a set of conditions. You can specify multiple groups of cells and multiple conditions that must be met. The function requires three inputs (but can use more…):

  • Average_Range – These are the cells to be included in the calculation of the average
  • Criteria_Range1 – This is the first set of cells you want to be evaluated for the condition
  • Criteria1 – This is the condition that must be met for the item in the Average_Range to be included in the calculation of the average
  • If you have more conditions to be evaluated, you can continue to add pairs of Criteria_Range2 and Criteria2, Criteria_Rang3 and Criteria3, etc.

This is a little vague until I tell you more about how we will design this spreadsheet to work.

Our goal will be to design a spreadsheet containing a separate tab for each rotisserie scoring category.

ROTO_CATEGORIES

And one tab that will analyze each scoring category and calculate the average needed to finish in each place for that category. For example, this table will show what the average batting average was for each of the 15 places in an NFBC Draft Champions league.

This is what the finished spreadsheet calculating the NFBC average standings will look like.

Each cell under the roto categories will contain an AVERAGEIFS formula. For example, the table tells us that first place in the Batting Average category had an average of 0.277. The formula in this cell is set up to look on the “BA” tab for the batting average of each team (the Average_Range), then look in the “Place in League” column (the Criteria_Range1) for any rows with a “1” in them (the Criteria).

That 0.277 calculation is the average of all (and only) first place teams.

Step-By-Step Instructions to Calculate SGP for NFBC Leagues

In the instructions that follow I’ll be calculating the SGP factors from the 2015 NFBC Draft Championship standings data.

Continue reading “How to Get Reliable SGP Data”

An Important Lesson and How to Resolve VLOOKUP Errors

Let me come clean. I screwed up. And it likely will cause you to see errors in your spreadsheets. That’s the whole reason for this post.

Having trouble with VLOOKUP error messages? This post should help.

What Happened?

While this post is going to address a very important topic (resolving VLOOKUP errors), there wasn’t much of a need for this until I came up with a new format for the Player ID Map. The intent was to make the Player ID Map easily updatable. I hate having to lookup the IDs, birth dates, and handedness of all the new players.

And it’s always bothered me that there was no easy way for you to get updated Player ID information.

Let’s be honest. It’s a pain in the ass. Especially this time of year when players are switching teams every day and minor league players we haven’t had to deal with in the past are now projected to reach the big leagues this season. It’s tedious to keep teams up-to-date and to add these new players.

I needed to find a way to improve this process and to make everyone’s lives a little easier.

The Solution

The solution was to make the Player ID Map available in an online CSV file. One you connect that online file to your Excel spreadsheet, you simply have to right-click on the Player ID Map and hit “Refresh”. You will instantly get any update I’ve made.

Sounds amazing, right?

Major leaguers  have a purely numeric Fangraphs ID while minor leaguers have text in their ID.
Major leaguers have a purely numeric ID while minor leaguers have text in their ID.

The Problem

The fly in the ointment happens to be the way Fangraphs structures their player IDs. Major leaguers, like Jose Abreu, have a purely numeric ID. Whereas minor leaguers that have not reach the big leagues, like Yoan Moncada, have the text “sa” in front of a string of numbers.

The unintended consequence of importing the Player ID Map file is that because some IDs contain text, Excel will treat the ENTIRE imported column as text.

The problem is that reports you download from Fangraphs and then open in Excel treat the player ID column as numeric values.

Warning… It’s About to Get Technical

If you’re fine with the old Player ID Map and the fact that it doesn’t get updated very often, you don’t have to use the new one. The old one can be downloaded here and will still be updated periodically. You can stop reading this post and save yourself some sanity.

But if a little complication doesn’t scare you off and you see the value in being able to refresh the Player ID Map and get regular updates… Keep reading.

Text and Numbers Are Treated Differently

Excel and most other computer applications treat text and numbers differently. And this is a common problem with VLOOKUPS. So the number “15676” is not the same as a text string of “15676”. So in our VLOOKUPS, we need to make sure we are comparing numbers to numbers and text to text.

Consider the Error Message

The first step in resolving a VLOOKUP problem is to understand the error message you’re seeing.

The “#N/A” error is the most common VLOOKUP error. And it essentially means that a match was not found during the lookup.

There are two main reasons a match would not be found:

  1. The item (player ID) doesn’t exist where you told Excel to look for it
  2. Or you told Excel to look for the wrong data type (look for a text value in a list of numbers, or vice versa)

These are the downloaded Steamer Projections. Abreu's ID is the there. It's in the first column. Why isn't the VLOOKUP finding this???
Abreu’s ID is the there. It’s in the first column. Why isn’t the VLOOKUP finding this???

You can easily test the first error by manually performing the search yourself. Let’s walk through a hypothetical example with Jose Abreu. He’s a well known player. He’ll surely be in the Steamer projections I’ve downloaded.

I see from the data that Abreu’s Fangraphs ID is 15676. If I trace that through into the Steamer Hitter projections, I am able to locate Abreu. So why isn’t the VLOOKUP finding the same match?

Continue reading “An Important Lesson and How to Resolve VLOOKUP Errors”

Important Player ID Map Update

I’m a little biased, but I think the Player ID Map is an invaluable tool.

But if I’m being honest… it has a really big weakness. When I make changes to it, there’s not a great way for me to get that updated information to you.

Until now!

The Easy-to-Update Player ID Map

After discovering that you can create a live connection from a Google Sheet to an Excel file, I have moved the Player ID Map into a Google Sheet.

The advantage of doing this is that you can link to this Google Sheet in your own spreadsheets. And if you download the Excel version, it will already have a pre-established link to the Google Sheet version.

How to Update the Player ID Map

Once you’ve downloaded the new version, you can simply right-click anywhere in the player listing and choose the option to “Refresh” the connection. Any changes will automatically pull into your file.

REFRESH_CONNECTION

The “Change Log” tab of the Player ID Map will work the same way. Right-click and refresh the connection on that page to get an updated listing of the changes that have been made.

CHANGE_LOG_PLAYER_ID

In the past you would have to come back to the site, download a new copy of the Excel file, and then paste it into your existing spreadsheets. Now you’ll just need to right click (or keep reading to see how you can have it update automatically) and update it!

The Links

The Player ID Map and Change Log are available in a variety of formats, depending on the goal you’re trying to accomplish.

Description Information
Updating Player ID Map Excel File Link: https://www.smartfantasybaseball.com/wp-content/uploads/2015/10/SFBB-Player-ID-Map.xlsx

This is a link to download the Player ID Map now containing a connection to an online source, so that when I add players to the list, they can easily be refreshed in your files.

Player ID Map Web Page Link: https://www.smartfantasybaseball.com/PLAYERIDMAPWEB

This is a web page version of the Player ID Map. You can web query it into your Excel files or simply look at the list if you’re searching for a piece of information.

Player ID Map CSV File Link: https://www.smartfantasybaseball.com/PLAYERIDMAPCSV

This link can be used to create a connection to an online CSV version of the Player ID Map that you can set up within Excel. We’ll take a closer look at how to do this in a set of instructions below.

Change Log Web Page Link: https://www.smartfantasybaseball.com/PLAYERIDMAPCHANGELOG

This is a web page version of the Player ID Map Change Log. You can web query it into your Excel files or simply look at the list of changes to see what updates have recently been applied.

Change Log CSV File Link: https://www.smartfantasybaseball.com/PLAYERIDMAPCHANGELOGCSV

Similar to the CSV of the actual Player ID Map, this link can be used to create a connection to the change log within Excel. We’ll take a closer look at how to do this in a set of instructions below.

What If I Currently Have the Old Player ID Map in my File?

It’s great that the newly downloaded Player ID Map comes with the connection. But what about those who have the old version? Here’s a short set of instructions of how to establish this connection.

Continue reading “Important Player ID Map Update”

How to Add Average Draft Position Info to Your Spreadsheet

I think you’re gonna like this one.

In this post I’ll show you how to link live average draft position information from the web into your draft spreadsheet. Every time you open your rankings file it will pull down updated ADP information. Bam!

How We’re Going To Do This

We will use a powerful feature of Excel called web querying to pull in the ADP information aggregated by FantasyPros.com (please note, I’m an affiliate of Fantasy Pros). The web query will suck up that table of ADP information and bring it directly into Excel for us to then VLOOKUP into our existing “Hitter Ranks” and “Pitcher Ranks” tabs.

Fantasy Pros has the best ADP information I've found on the web. They have the most sources in one place and it appears to be updated regularly.
Fantasy Pros has the best ADP information I’ve found on the web. They have the most sources in one place and it appears to be updated regularly.

Assumptions

I am assuming that you’ve followed my Standings Gain Points or Points-League Ranking series and are already starting with a spreadsheet that is based off one of those (you don’t have to have those exact spreadsheets, but something similar).

Excel Functions and Concepts Used in this Post

Web Query

As you can probably imagine, the power of the web query is that it automatically updates the data in your Excel file without you having to do ANYTHING after the initial setup.

Web queries are created from the “Data” tab on the Excel Ribbon, under the “Get External Data” icon grouping. There are several ways to get data from outside sources into Excel, we will be using the “From Web” button.

GET_EXTERNAL_DATA

One “weakness” I have found in web queries is that they cannot work with “tables” in Excel. You cannot pull a web query in as the data of a table. If you’re a big follower of this site you know that’s a bit of an issue for me because I use tables all the time. Thankfully this doesn’t prevent us from doing things, I just point it out because you might wonder why I set things up the way I do in the instructions below.

Find

The FIND function searches within a specified cell for a string of text that you provide. If the FIND function locates the string, it will return the character position where the string starts at.

I know, you’re thinking “What the heck does that even mean?”. Here’s an example. Let’s say we have the text “Mike Trout (LAA)” in a cell and every player in our whole spreadsheet follows that format. If we want to pull out each player’s team we will need to start by figuring out where the team name starts in that cell. And we can’t just say it will always start at the 13th character each time when we have players like this hanging around MLB.

Instead we can use the FIND formula to intelligently determine where that opening parenthesis is for each player (it starts at 12 for Trout and 23 for Salty).

This formula requires two inputs:

FIND(Find_text, Within_text)

FIND

  1. Find_text – This is the string of text you are searching for and keep in mind it is case-sensitive. You would wrap the string you are searching for in quotation marks. So in our example above, to look for the opening parenthesis you would enter “(” here. Or if you’re trying to be slightly more precise, you could enter ” (“, a space before the parenthesis.

  2. Within_text – This is the text you want to search WITHIN. This can be a cell number.

Left

The LEFT function gives you the leftmost number of characters in a text string. You also get to specify the number of characters to specify.

For example, if you have a text string of “Mike Trout (LAA)” and you ask for the 10 leftmost characters in that string, you would get “Mike Trout” back.

This formula requires two inputs:

LEFT(Text, Num_chars)

LEFT_FUNCTION

  1. Text – This is the text string you want the leftmost characters from.
  2. Num_chars – This is the number of characters you want from the string. This can be a hard entered number (e.g. 10) or it can be a formula itself that results in a number.

Combining Functions Together

We can do something pretty powerful by combining the FIND and LEFT functions together. I’ve been hinting at it with this “Mike Trout (LAA)” example. Recall from above that the LEFT function wants to know our text string (“Mike Trout (LAA)”) and the number of characters on the left to pull from that string.

Assume that cell B2 has a value of “Mike Trout (LAA)”. Instead of using this formula:

LEFT(B2, 10)

We can use this:

LEFT(B2, FIND(" (",B2)-1)

The FIND(" (",B2)-1 part of the formula returns a 10 (if you don’t subtract the one it returns an 11), and “Mike Trout” has 10 characters in it (including the space). By using this combination of functions we don’t have to type in a “10” for Mike Trout and a “21” for Saltalamacchia.

Important Prerequisite

Before you’re able to proceed with the instructions below you must make sure the PLAYERIDMAP in the file you’re working with was updated after February 21st, 2015. I added a column to the Player ID Map called “FANTPROSNAME” that is necessary for the steps below to work.

Instructions for updating your PLAYERIDMAP can be found here. Completing the update should only take five minutes or so.

Step-by-Step Instructions

Continue reading “How to Add Average Draft Position Info to Your Spreadsheet”

How to Update the Player ID Map in your Spreadsheets

Warning – The instructions below are likely only relevant if you are following some of my much older work. The Player ID Map has since been updated to allow much easier updating. If you’re looking for guidance relating to a spreadsheet you’ve built or purchased since 2015, you likely want to be looking here for guidance relating to the Player ID Map.

You’ve been following the site for a while. You’ve even created a spreadsheet to develop your own points league or SGP rankings. You’ve spent all this time building this spreadsheet but it’s getting to be a bit out of date. Players have been traded, rookies have been called up from the minors…

How do you update things? Do you have to rebuild your spreadsheets from scratch each season?

No way, give me some credit! I’m smarter than that. I design things to be reusable.

In this post I’ll show you how to quickly and easily update the Player ID Map in your spreadsheet so you can get updated MLB teams and have new players available to tie in to your projections.

Warning!

All we’re really doing here is downloading the new version of the Player ID Map and pasting it on top of our existing Player ID Map already in your ranking file. The key is that you have to be very particular about how you paste the new version in. If you’re not careful you will break all the existing formulas in your spreadsheet that reference the PLAYERIDMAP named table.

Read carefully!

Step-by-Step Instructions

Step Description
1. Open your existing rankings spreadsheet, the one in which you want the new Player ID Map information. Save a backup copy of the file, just in case something were to go wrong during this process.

Go to the PLAYERIDMAP tab.PLAYER_ID_MAP

2. We will soon be pasting information onto this sheet so it is important to make sure all the data is currently showing.

Click on Excel’s “Data” tab and then click the “Clear” button of the “Sort & Filter” icon grouping. CLEAR_FILTERS

3. Click this link to download an updated copy of the Player ID Map.

Once the download completes, open the file. If Excel is displaying any kind of warning message, enable your ability to edit the file (provided you trust this site).ENABLE_EDITING

Now refresh the content to pull in any recently added players. Do this by right-clicking on a cell within the table (somewhere within the blue and white rows of data). Then choose the option to “Refresh.”

4. Place your mouse in cell A1 of the newly downloaded Player ID Map. Then hit the CTRL + SHIFT + End keys all at once. After you’ve done this release the keys. Then hit SHIFT + the up arrow key.LAST_PLAYER
This set of key strokes should select the entire Player ID Map table and then deselect the “Last Player”.

Now hit CTRL + C to copy the selected data.

5. Return to your customized rankings spreadsheet. Select cell A1 with your mouse and then paste the data you just copied over cell A1.

The reasoning behind this specific set of copying and pasting instruction is so that the existing table named “PLAYERIDMAP” in your rankings spreadsheet will not be renamed during this process. If you don’t deselect the “Last Player” before copying, the entire Player ID Map table will be renamed and it will break all existing VLOOKUP formulas you have looking for this information.

6. That’s it!

Well, kind of. Any new players added to the PLAYERIDMAP will not yet be listed on your “Hitter Ranks” or “Pitcher Ranks” worksheets.

This is where you have a decision to make.

If you have taken notes next to players, entered keeper dollar values, or otherwise “hard entered” information that relates to a specific player, then you manually add the player IDs of “new” players to your “Hitter Ranks” or “Pitcher Ranks” tabs.

For example, simply go to the “Hitter Ranks” tab and type the player’s ID at the very bottom of the first column. When you hit enter the Excel table should grow to add your new player and all the other formulas should automatically copy down (another benefit of using Excel tables!). FRANCISCO_LINDOR

If you’re not sure what players were added to the PLAYERIDMAP, you can look on the “CHANGE LOG” tab on the newly downloaded Player ID file to see a brief note of all the players added or updated recently. CHANGE_LOG

I try to put brief descriptions of the players that have been added so you can manually add to your “Hitter Ranks” or “Pitcher Ranks” sheets, if necessary.CHANGE_LOG_INFO

7. If you have not edited dollar values or added player notes, you can copy and paste the hitter IDs onto the “Hitter Ranks” sheet and the pitcher IDs on to the “Pitcher Ranks” sheet.

To do this, go to the PLAYERIDMAP tab in your spreadsheet and apply a filter to only show hitters. On the “POS” column filter, uncheck the “N/A” (if there are any) and “P” check boxes. This will only display the hitters.POSITION_FILTER

Then select cell the first cell below the header in column A and hit the SHIFT + CTRL + Down Arrow Key. SHIFT_CTRL_DOWN
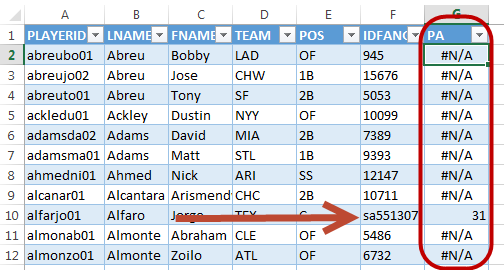
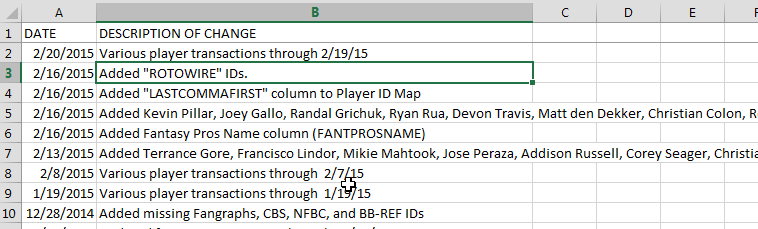
Copy this information and go to your “Hitter Ranks” tab and paste it into the first cell below the header in column A there.PASTE_HITTER_LIST

After you do this all the other information on the tab should update immediately.

No go back to the PLAYERIDMAP tab and adjust the filter to only show pitchers and repeat the process by pasting those players onto the “Pitcher Ranks” tab.

Now you’re done!

Have Any Questions?

Please leave a comment on this post.

I have to do this quite frequently to keep all the spreadsheets I maintain for the site up-to-date, but this is probably something you’ll only need to do a few times a year. Maybe after the season ends, to get all the new players I’ve added during the season, late February, to get all the players that have changed teams, and once during the season, if you’re doing in-season rankings.

Want More Tips Like This

Make sure to follow me on Twitter, that’s the best place to hear about new posts and updates at the site.

New Excel Tool – SGP Slope Calculator

I can’t believe it took me so long to think of this! In this post I’ll share a new Excel template I created to help calculate your SGP factors (or SGP denominators).

One of the very first posts I wrote on this site was about “Calculating What it Takes to Win Your League”. I’ve then gone on to write many articles about standings gain points and even about an improvement in the process I found by reading Art McGee’s book “How to Value Players for Rotisserie Baseball” (It’s quite expensive at Amazon but Baseball HQ has had it on “Inventory Closeout” for quite a long time).

So after a few years of writing about SGP it finally dawned on me that, “I should create an Excel file that wraps all this together.” So that’s what I’ve tried to do. The “SGP Calculator” asks a few simple setup questions about your league, the amount of history you want to use, and then uses the SLOPE formula to calculate the standings gain points for each of your league’s scoring categories.

Here’s How the “SGP Calculator” Works

The first tab is aptly named “ANSWER THESE QUESTIONS FIRST”. Several of these are very important in determining how the slope calculations are made so don’t skip over this.SGP_SLOPE_SETUP_QUESTIONS

The Excel file can accommodate up to eight different hitting and pitching categories, up to 10 years of standings information, and up to 15 teams. Use the drop down menus on this tab to select your league’s setting.

The next tab in the spreadsheet is “SGP CALCULATIONS”. Let’s skip over that for now and circle back to it.

SGP_CALCULATIONS

The yellow colored tabs are where you will enter your league history of the overall standings and the totals in each individual category. There are tabs for “Historical Final Standings” (where you’ll enter the total ending roto points for each team), “Hitter Stats”, and “Pitcher Stats”.

There are 17 yellow tabs.  One for overall standings and then eight each for hitting and pitching categories.
There are 17 yellow tabs. One for overall standings and then eight each for hitting and pitching categories.

Each yellow tab displays the “Category Name” in the top left (see “Batting Average” example below). You can enter the history for that category in the table below. Because the spreadsheet has been set up to accommodate 15 teams and 10 years of history you may see several rows and columns with labels “DO NOT ENTER DATA”. Just ignore those rows and columns and only enter data for the years and number of teams you have selected.

The image is large but I had to shrink it to fit here.  Click the image to see the full version.
The image is large but I had to shrink it to fit here. Click the image to see the full version.

Now we can return to the “SGP CALCULATIONS” tab, the end result. It displays the average statistics for each scoring category and uses Excel’s SLOPE formula to calculate the SGP factor (denominator) for each category.

Click the image to see the full-sized version.

These are the same SGP factors you would then plug into your customized rankings.

Download the File

Continue reading “New Excel Tool – SGP Slope Calculator”