The SFBB Excel tools are updated and ready to help you prepare for the 2026 season! If you’re looking to build skills and develop your own methods for ranking and valuing players, these are for you!
The Automated SGP Ranking Tool will help you convert your favorite projection set (Steamer, The Bat, Razzball, RotoWire, PECOTA, etc.) into Excel-based rankings and dollar values tailored to your own league’s settings. The process takes only minutes. No messy Excel formulas. Just load your projections into the file, adjust a few settings, and standings gain points rankings are calculated automatically. Click here to read more about the tool.
Powered by the same concepts as the Automated SGP Ranking Tool, the Automated Points League Ranking Tool does all the same things, just for nearly any imaginable points league. The tool works with any popular projection set and allows you to enter your league’s unique point scoring system, then instantly converts those projections into tailored point totals and dollar values. The process take minutes and will give a huge advantage over owners that are not tailoring rankings specifically to the league scoring system. Click here to read more about the points league tool.
An easy-to-use Excel spreadsheet that can combine (or average) up to five different projection sets. The aggregator can use just about any well-known projection set you can find on the web (if you find one that doesn’t work, let me know!). Simply download your favorite projection sets, fill out some settings, and you’re done. No complicated formulas or VLOOKUPS for you to add.
This year’s edition of The Process contains many exciting new updates, studies, standings, and SGP data. Visit thefantasybaseballprocess.com to read many more details.
The SFBB Excel tools are updated and ready to help you prepare for the 2025 season! If you’re looking to build skills and develop your own methods for ranking and valuing players, these are for you!
The Automated SGP Ranking Tool will help you convert your favorite projection set (Steamer, The Bat, Razzball, RotoWire, PECOTA, etc.) into Excel-based rankings and dollar values tailored to your own league’s settings. The process takes only minutes. No messy Excel formulas. Just load your projections into the file, adjust a few settings, and standings gain points rankings are calculated automatically. Click here to read more about the tool.
Powered by the same concepts as the Automated SGP Ranking Tool, the Automated Points League Ranking Tool does all the same things, just for nearly any imaginable points league. The tool works with any popular projection set and allows you to enter your league’s unique point scoring system, then instantly converts those projections into tailored point totals and dollar values. The process take minutes and will give a huge advantage over owners that are not tailoring rankings specifically to the league scoring system. Click here to read more about the points league tool.
An easy-to-use Excel spreadsheet that can combine (or average) up to five different projection sets. The aggregator can use just about any well-known projection set you can find on the web (if you find one that doesn’t work, let me know!). Simply download your favorite projection sets, fill out some settings, and you’re done. No complicated formulas or VLOOKUPS for you to add.
This year’s edition of The Process contains many exciting new updates, studies, standings, and SGP data. Visit thefantasybaseballprocess.com to read many more details.
The SFBB Excel tools are updated and ready to help you prepare for the 2024 season! If you’re looking to build skills and develop your own methods for ranking and valuing players, these are for you!
The Automated SGP Ranking Tool will help you convert your favorite projection set (Steamer, The Bat, Razzball, RotoWire, PECOTA, etc.) into Excel-based rankings and dollar values tailored to your own league’s settings. The process takes only minutes. No messy Excel formulas. Just load your projections into the file, adjust a few settings, and standings gain points rankings are calculated automatically. Click here to read more about the tool.
Powered by the same concepts as the Automated SGP Ranking Tool, the Automated Points League Ranking Tool does all the same things, just for nearly any imaginable points league. The tool works with any popular projection set and allows you to enter your league’s unique point scoring system, then instantly converts those projections into tailored point totals and dollar values. The process take minutes and will give a huge advantage over owners that are not tailoring rankings specifically to the league scoring system. Click here to read more about the points league tool.
An easy-to-use Excel spreadsheet that can combine (or average) up to five different projection sets. The aggregator can use just about any well-known projection set you can find on the web (if you find one that doesn’t work, let me know!). Simply download your favorite projection sets, fill out some settings, and you’re done. No complicated formulas or VLOOKUPS for you to add.
The SFBB Excel tools are updated and ready to help you prepare for the 2023 season! If you’re looking to build skills and develop your own methods for ranking and valuing players, these are for you!
The Automated SGP Ranking Tool will help you convert your favorite projection set (Steamer, The Bat, Razzball, RotoWire, PECOTA, etc.) into Excel-based rankings and dollar values tailored to your own league’s settings. The process takes only minutes. No messy Excel formulas. Just load your projections into the file, adjust a few settings, and standings gain points rankings are calculated automatically. Click here to read more about the tool.
Powered by the same concepts as the Automated SGP Ranking Tool, the Automated Points League Ranking Tool does all the same things, just for nearly any imaginable points league. The tool works with any popular projection set and allows you to enter your league’s unique point scoring system, then instantly converts those projections into tailored point totals and dollar values. The process take minutes and will give a huge advantage over owners that are not tailoring rankings specifically to the league scoring system. Click here to read more about the points league tool.
An easy-to-use Excel spreadsheet that can combine (or average) up to five different projection sets. The aggregator can use just about any well-known projection set you can find on the web (if you find one that doesn’t work, let me know!). Simply download your favorite projection sets, fill out some settings, and you’re done. No complicated formulas or VLOOKUPS for you to add.
This year’s edition of The Process contains many exciting new updates, studies, standings, and SGP data. Visit thefantasybaseballprocess.com to read many more details.
The SFBB Excel tools are updated and ready to help you prepare for the 2022 season! If you’re looking to build skills and develop your own methods for ranking and valuing players, these are for you!
The Automated SGP Ranking Tool will help you convert your favorite projection set (Steamer, The Bat, Razzball, RotoWire, PECOTA, etc.) into Excel-based rankings and dollar values tailored to your own league’s settings. The process takes only minutes. No messy Excel formulas. Just load your projections into the file, adjust a few settings, and standings gain points rankings are calculated automatically. Click here to read more about the tool.
Powered by the same concepts as the Automated SGP Ranking Tool, the Automated Points League Ranking Tool does all the same things, just for nearly any imaginable points league. The tool works with any popular projection set and allows you to enter your league’s unique point scoring system, then instantly converts those projections into tailored point totals and dollar values. The process take minutes and will give a huge advantage over owners that are not tailoring rankings specifically to the league scoring system. Click here to read more about the points league tool.
An easy-to-use Excel spreadsheet that can combine (or average) up to five different projection sets. The aggregator can use just about any well-known projection set you can find on the web (if you find one that doesn’t work, let me know!). Simply download your favorite projection sets, fill out some settings, and you’re done. No complicated formulas or VLOOKUPS for you to add.
Looking to get a jump on the 2021 season? Here are the Excel tools and books that are updated and ready to help you prepare for the upcoming season. If you’re looking to build skills and develop your own methods for ranking and valuing players, these are for you! All of the spreadsheet tools listed below have been updated for the 2021 season.
We are sorry to announce that there will not be major updates to The Process for the 2021 edition. Among other things, the shutdown and restarting of the season, the rule changes, the odd schedules, and the seven-inning games would have us questioning the validity of any innovative research.
With that in mind, we’ve decided to offer two editions this year, so our readers can choose the version that’s right for them.
2021 Appendix Edition (PDF) – $7.99
This is the edition for owners that have previously read the 2020 edition and are now looking for updated 2021 appendix data. This slimmed-down version contains just the 65-page appendix containing SGP analysis, Steamer projections, standings data for 2018-2020, and Jeff and Tanner’s thoughts on how to use the standings data from the 2020 season. Click here to purchase the Appendix Only 2021 Edition in a PDF e-book format for $7.99.
Full 2021 Edition (PDF) – $17.99
If you have not previously bought the book, this is the edition for you. The body of this book is the same as the 2020 edition, with an updated appendix. The appendix is updated for various leagues’ standings gains points (SGP), 2021 Steamer projections with the SGP, projected handedness splits, and others. Click here to purchase the Full 2021 Edition in a PDF e-book format for $17.99.
The Automated SGP Ranking Tool will help you convert your favorite projection set (Steamer, The Bat, Razzball, RotoWire, PECOTA, etc.) into Excel-based rankings and dollar values tailored to your own league’s settings. The process takes only minutes. No messy Excel formulas. Just load your projections into the file, adjust a few settings, and standings gain points rankings are calculated automatically. Click here to read more about the tool.
Powered by the same concepts as the Automated SGP Ranking Tool, the Automated Points League Ranking Tool does all the same things, just for nearly any imaginable points league. The tool works with any popular projection set and allows you to enter your league’s unique point scoring system, then instantly converts those projections into tailored point totals and dollar values. The process take minutes and will give a huge advantage over owners that are not tailoring rankings specifically to the league scoring system. Click here to read more about the points league tool.
An easy-to-use Excel spreadsheet that can combine (or average) up to three different projection sets. The aggregator can use just about any well-known projection set you can find on the web (if you find one that doesn’t work, let me know!). Simply download your favorite projection sets, fill out some settings, and you’re done. No complicated formulas or VLOOKUPS for you to add.
Looking to get a jump on the 2020 season? Here are the Excel tools and books that are updated and ready to help you prepare for the upcoming season. If you’re looking to build skills and develop your own methods for ranking and valuing players, these are for you! All of the spreadsheet tools listed below have been updated for the 2020 season.
Co-authored with Jeff Zimmerman, this is our comprehensive guide of the process we use to succeed during a fantasy baseball season. From preseason preparations, the draft, and all the stages of the season, it’s everything we know about playing this game. The book is available in a PDF e-book for $17.99 here or in paperback form at Amazon here.
You can read a comprehensive writeup of all that’s included in the book here, including the foreword by Clay Link, the full table of contents, and testimonials by fantasy analysts like Rob Silver, Rudy Gamble, Eno Sarris, Mike Podhorzer, and Mike Gianella.
The Automated SGP Ranking Tool will help you convert your favorite projection set (Steamer, The Bat, Razzball, RotoWire, PECOTA, etc.) into Excel-based rankings and dollar values tailored to your own league’s settings. The process takes only minutes. No messy Excel formulas. Just load your projections into the file, adjust a few settings, and standings gain points rankings are calculated automatically. Click here to read more about the tool.
Powered by the same concepts as the Automated SGP Ranking Tool, the Automated Points League Ranking Tool does all the same things, just for nearly any imaginable points league. The tool works with any popular projection set and allows you to enter your league’s unique point scoring system, then instantly converts those projections into tailored point totals and dollar values. The process take minutes and will give a huge advantage over owners that are not tailoring rankings specifically to the league scoring system. Click here to read more about the points league tool.
An easy-to-use Excel spreadsheet that can combine (or average) up to three different projection sets. The aggregator can use just about any well-known projection set you can find on the web (if you find one that doesn’t work, let me know!). Simply download your favorite projection sets, fill out some settings, and you’re done. No complicated formulas or VLOOKUPS for you to add.
Ever wanted to create your own rotisserie rankings? This is my instructional guide written specifically to show you how to create customized rotisserie player rankings, dollar values, and inflation dollar values, in Microsoft Excel, tailored to your own league. No more downloading rankings from the web, hoping they apply to your unique league. 10, 12, or 15-team league? $260 or $300 budget? AL-only or mixed league? 10 hitters or 14? It doesn’t matter. This book will guide you through the process of developing rankings for just about any kind of rotisserie league.
My step-by-step guide to building custom rankings, dollar values, and inflation dollar values, in Microsoft Excel, for your points league. This book will guide you through the process of developing rankings for just about any point-based scoring format.
This year’s edition of The Process is now available!
About the Book
A very thorough and detailed write-up of what’s included in the book is available here. At a high level, this book is everything Jeff Zimmerman and I know about how to play rotisserie baseball (and even points leagues). Regardless your level of experience, I guarantee it includes pages and pages of unique ideas, research, and data you have never seen before. We continue to pour our new ideas, new research, and recent realizations into it. The e-book is 265 pages and includes 58 additional pages of appendices full of projections, statistics, and helpful information.
The paperback edition of the book can be purchased from Amazon.com by clicking here.
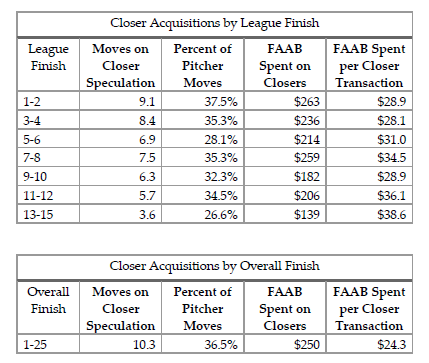
Keep reading for details on all that was added to this 2020 edition, but my favorite addition is a detailed study that performed on the 2018 NFBC Main Event, including all the player adds, player drops, and final standings of all 34 leagues and 510 teams. The study sought to confirm if the advice and strategies in the book can be observed and corroborated in the actions of the game’s best managers. The NFBC Main Event, with its $1,700 buy in, prestigious name, and overall competition aspect, offers the best laboratory to study this.
That new study delves into many topics:
How much does draft position affect the chances of winning a league?
Do better owners just accrue more playing time? Or are their players also accumulating more stats per AB and per IP? How much more?
How many free agent transactions do the best teams make?
How do these better owners spread their transactions throughout the season?
How do these better owners allocate their FAAB spending?
What bidding patterns can be observed from winning teams?
How do these owners allocate transactions between hitters and pitchers?
How often do these owners acquire two-start pitchers? Closers?
How much season-long value do these owners acquire and drop during the season?
How much weekly value do these owners acquire and drop during the season?
For example, here’s a table of data in the section analyzing how owners finish in the standings and the amount of moves spent on closer speculation.
Closer acquisitions in the 2018 NFBC Main Event.
A Personal Note
I’m really proud of this book. Or shall I say, this annual publication that we’ve started. But the intent to have annual editions creates a significant challenge. The book’s main strength is its long-term nature. Much of what we discuss are fundamental concepts to success at rotisserie baseball. Those ideas are not going to change much from year-to-year. It’s certainly going to be a test to keep the book relevant and worthy of your time and money. We understand that.
I am confident we can do this. Afterall, I’ve been writing on this site for several years now, exclusively with a long-term slant to my analysis. I don’t have much time to write. So I choose to focus my efforts doing research, writing instructions, and building tools that will have long-term benefits. I simply don’t have time to devote to writing short-term pieces that will be irrelevant within weeks or even days. Despite blogging for several years and having written a handful of books, I still feel as though we’re finding new ways to play and think about rotisserie baseball. I see no shortage of strategy-related questions to research.
You can see this in the topics we expanded in this year’s book. Among the higher-level strategy questions approached in this year’s book are:
Are rookies more volatile than established hitters? Does a rookie’s upside offset the possible downside? Do rookie projections differ from the projections of MLB regulars?
How much does a player’s previous levels of fantasy-production affect their future performance? Do these players offer a higher return on investment than those that have never before attained a given production level?
What are the key differences owners should know about the SGP and z-score player valuation models? Where are these systems similar?
How does the cost of closers during the draft compare to their cost in free agency (FAAB)? How does the cost of starting pitchers differ?
How much value should multi-position eligibility add to a player’s valuation? (Note: This topic was included last year, but we expanded our thoughts)
Having studied how weekly values appear in 12-team leagues during the 2017 season, how much did things change in 2018? How does the appearance of weekly values change in a 15-team league?
What do average weekly statistics lines look like for players? For example, what does a $30-35 weekly hitter line look like? What do valuable weekly pitcher statistics look like?
What strategies and behaviors can we observe from the NFBC’s amazing data (standings, adds, drops, etc.)? What behaviors lead to success? What beliefs about how to best play rotisserie baseball can we confirm by studying this data?
On top of all this, Jeff and I continue to evolve the way we play the game and we share those changes and decisions with you. Here are the new discussions of strategies, tips, and tools included this year:
We co-owned a team together this season. We share what we learned from this experience, both during the draft and in-season. Our general recommendation is that partnering is very helpful, especially for leagues where there is a grind of weekly transactions.
To that end, we outline the weekly FAAB process we went through together on that shared league. Having a consistent weekly routine is the key to uncovering valuable players and to avoiding under- or over-bidding. We share the process that works for us.
We outline the specific tools we use to identify FAAB targets and two-start pitchers. We also share the process we go through for setting lineups and finding important last-minute MLB news.
We explored different approaches to dealing with catchers this past season. We share the results of those strategies.
We share a FAAB binning strategy that helps owners stay disciplined about overbidding and maintaining a healthy weekly budget.
Do you have to read through the entire book hunting for what’s new? No! We kept track for you. You can see a full list of changes and jump right to the updated content. Here’s what that list looks like.
Please Click the ‘Buy Now’ Button Below to Purchase the e-Book for $17.99
After clicking the “Buy Now” button, you’ll be taken through an online checkout process using PayPal. There is also an option to pay with a debit or credit card. After completing the purchase, a link to download the PDF book will immediately be e-mailed to you. You can read the PDF on any mobile device, PC, or tablet.
Or Click Below to Buy the Paperback Edition at Amazon for $22.99
I partnered Jeff Zimmerman (Fangraphs, Rotowire, Fantrax, multiple-time Tout Wars Champ) to write this comprehensive e-book guide (PDF) that outlines the start-to-finish process we go through during a fantasy baseball season. Please click here to buy The Process e-book.
How to Win Your League
The book is a chronological guide through the fantasy baseball season, with the main goal being to help you win your league. The topics covered are:
Use of Projections
How to Adjust Projections
How to Convert Projections to Values/Rankings
How to Adjust Values and Rankings
Draft & Auction Preparation
Draft & Auction Strategy
In-season Management & Strategy
End-of-season Management & Strategy
Wrapping Up the Season
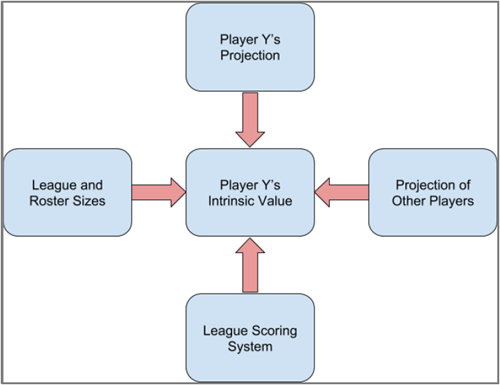
Player valuation and how it is determined are big themes in the book.
As you read through that list, you may be thinking, “I already know that topic,” or, “What more could be said about that?” But that is what I’m most proud of. I think we managed to provide unique perspective, insights, and studies that have not been seen before.
If you’re not an experienced owner and you’re looking for a place to start, The Process can help you too. It is a comprehensive guide, but we also present shortcuts and alternate ways of doing things. You can pick and choose the topics or areas in which you want to expand your game. Adding one or two new strategies or tactics to your own process each season is a great way to improve over time.
I’m also very proud of the way we were able to weave in a lot of theory, so owners are not just presented with a way of doing things, but can also understand the “why”, so it can be applied to similar situations in the future.
Cognitive biases and other decision-making concepts are also sprinkled throughout the book. We believe this combination of process, theory, and decision-making tactics makes The Process a unique tool for fantasy owners.
Tell Me More About What’s Included
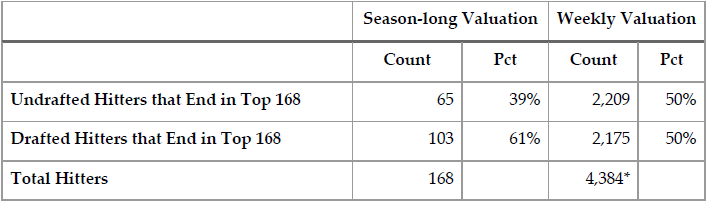
One of the more interesting studies included in the book is around the concept of weekly player values. Much of the research and decision-making fantasy owners do centers around annual valuations for players. Yet outside of draft and hold leagues, we don’t make decisions on an annual time horizon. Most owners must make decisions on a weekly or even daily basis. A study of weekly player valuations sheds light on how well we capture value in the preseason, what kinds of players create weekly value, and when new value appears during the season.
This table is one of many in a study of how well fantasy owners do at capturing weekly hitter and pitcher value.
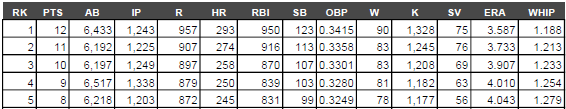
The book also includes average standings data and standings gain points calculations for many popular league variations. Save hours of time having to calculate these yourself!
Example AL-Only OBP Average League Standings Data
This data is provided for the following league types:
15-team, Standard League (14 hitters, 9 pitchers)
15-team, 1-Catcher League (2 utility hitters)
15-team, OBP League (instead of batting average>
15-team, Draft and Hold League (no in-season pickups)
12-team, Standard League
12-team, OBP League
12-team, AL-only Standard League
12-team, NL-only Standard League
12-team, AL-only OBP League
12-team, NL-only OBP League
What Do Others Have to Say?
You don’t just have to take my word for it. Some of the minds I most respect in the fantasy baseball community have taken the time to read the book and offer their feedback (Rob Silver, Rudy Gamble, Eno Sarris, Mike Podhorzer, Mike Gianella). You can see what they had to say here.
Please Click the ‘Buy Now’ Button Below to Purchase the e-Book for $17.99
After clicking the “Buy Now” button, you’ll be taken through an online checkout process using PayPal. There is also an option to pay with a debit or credit card. After completing the purchase, a link to download the PDF book will immediately be e-mailed to you. You can read the PDF on any mobile device, PC, or tablet.
Warning – The instructions below are likely only relevant if you are following some of my much older work. The Player ID Map has since been updated to allow much easier updating. If you’re looking for guidance relating to a spreadsheet you’ve built or purchased since 2015, you likely want to be looking here for guidance relating to the Player ID Map.
You’ve been following the site for a while. You’ve even created a spreadsheet to develop your own points league or SGP rankings. You’ve spent all this time building this spreadsheet but it’s getting to be a bit out of date. Players have been traded, rookies have been called up from the minors…
How do you update things? Do you have to rebuild your spreadsheets from scratch each season?
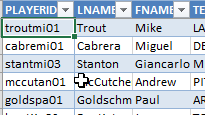
In this post I’ll show you how to quickly and easily update the Player ID Map in your spreadsheet so you can get updated MLB teams and have new players available to tie in to your projections.
Warning!
All we’re really doing here is downloading the new version of the Player ID Map and pasting it on top of our existing Player ID Map already in your ranking file. The key is that you have to be very particular about how you paste the new version in. If you’re not careful you will break all the existing formulas in your spreadsheet that reference the PLAYERIDMAP named table.
Read carefully!
Step-by-Step Instructions
Step
Description
1.
Open your existing rankings spreadsheet, the one in which you want the new Player ID Map information. Save a backup copy of the file, just in case something were to go wrong during this process.
Go to the PLAYERIDMAP tab.
2.
We will soon be pasting information onto this sheet so it is important to make sure all the data is currently showing.
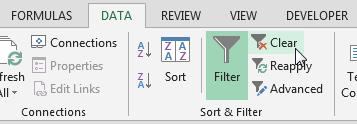
Click on Excel’s “Data” tab and then click the “Clear” button of the “Sort & Filter” icon grouping.
Once the download completes, open the file. If Excel is displaying any kind of warning message, enable your ability to edit the file (provided you trust this site).
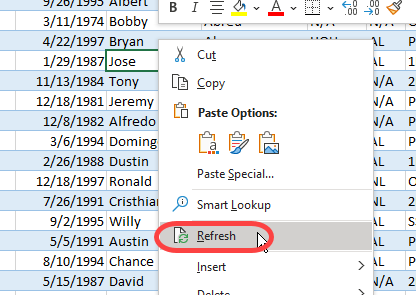
Now refresh the content to pull in any recently added players. Do this by right-clicking on a cell within the table (somewhere within the blue and white rows of data). Then choose the option to “Refresh.”
4.
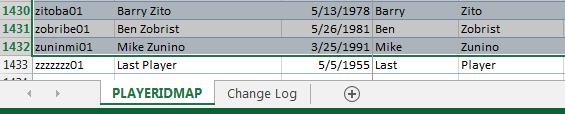
Place your mouse in cell A1 of the newly downloaded Player ID Map. Then hit the CTRL + SHIFT + End keys all at once. After you’ve done this release the keys. Then hit SHIFT + the up arrow key.
This set of key strokes should select the entire Player ID Map table and then deselect the “Last Player”.
Now hit CTRL + C to copy the selected data.
5.
Return to your customized rankings spreadsheet. Select cell A1 with your mouse and then paste the data you just copied over cell A1.
The reasoning behind this specific set of copying and pasting instruction is so that the existing table named “PLAYERIDMAP” in your rankings spreadsheet will not be renamed during this process. If you don’t deselect the “Last Player” before copying, the entire Player ID Map table will be renamed and it will break all existing VLOOKUP formulas you have looking for this information.
6.
That’s it!
Well, kind of. Any new players added to the PLAYERIDMAP will not yet be listed on your “Hitter Ranks” or “Pitcher Ranks” worksheets.
This is where you have a decision to make.
If you have taken notes next to players, entered keeper dollar values, or otherwise “hard entered” information that relates to a specific player, then you manually add the player IDs of “new” players to your “Hitter Ranks” or “Pitcher Ranks” tabs.
For example, simply go to the “Hitter Ranks” tab and type the player’s ID at the very bottom of the first column. When you hit enter the Excel table should grow to add your new player and all the other formulas should automatically copy down (another benefit of using Excel tables!).
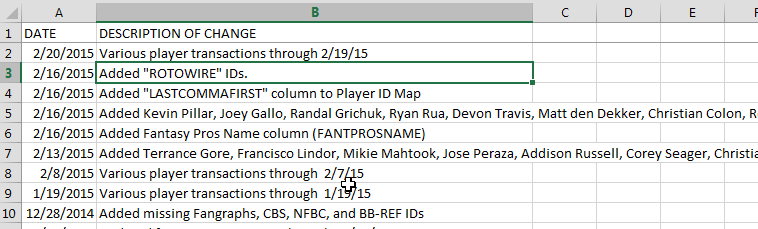
If you’re not sure what players were added to the PLAYERIDMAP, you can look on the “CHANGE LOG” tab on the newly downloaded Player ID file to see a brief note of all the players added or updated recently.
I try to put brief descriptions of the players that have been added so you can manually add to your “Hitter Ranks” or “Pitcher Ranks” sheets, if necessary.
7.
If you have not edited dollar values or added player notes, you can copy and paste the hitter IDs onto the “Hitter Ranks” sheet and the pitcher IDs on to the “Pitcher Ranks” sheet.
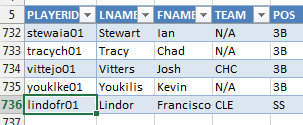
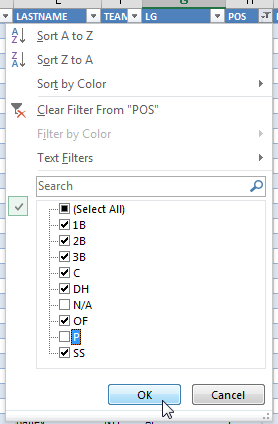
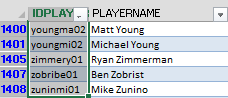
To do this, go to the PLAYERIDMAP tab in your spreadsheet and apply a filter to only show hitters. On the “POS” column filter, uncheck the “N/A” (if there are any) and “P” check boxes. This will only display the hitters.
Then select cell the first cell below the header in column A and hit the SHIFT + CTRL + Down Arrow Key. Copy this information and go to your “Hitter Ranks” tab and paste it into the first cell below the header in column A there.
After you do this all the other information on the tab should update immediately.
No go back to the PLAYERIDMAP tab and adjust the filter to only show pitchers and repeat the process by pasting those players onto the “Pitcher Ranks” tab.
Now you’re done!
Have Any Questions?
Please leave a comment on this post.
I have to do this quite frequently to keep all the spreadsheets I maintain for the site up-to-date, but this is probably something you’ll only need to do a few times a year. Maybe after the season ends, to get all the new players I’ve added during the season, late February, to get all the players that have changed teams, and once during the season, if you’re doing in-season rankings.
Want More Tips Like This
Make sure to follow me on Twitter, that’s the best place to hear about new posts and updates at the site.
We use cookies to ensure that we give you the best experience on our website. If you continue to use this site we will assume that you are happy with it.


 Copy this information and go to your “Hitter Ranks” tab and paste it into the first cell below the header in column A there.