Contents
This post is intended to be an all-encompassing discussion of the Player ID Map tool. Click the links below to jump directly to a specific section below. Use the Back browser or mouse button to jump back to this list.
- What is the Player ID Map?
- What Versions of the Tool are Available?
- How Do I Update or Refresh the Player ID Map?
- Origin
- Do People Really Use This Thing?
- Does the Player ID Map Include all MLB Players?
- Are Players Ever Removed from the Player ID Map?
- What are Some Practical Examples of How to Use the Player ID Map?
- What ID Systems Are Included in the Player ID Map?
- What Other Information is Included in the Player ID Map?
- Why are the Columns in Such a Weird Order?
- How to Handle Missing Players or Make Edits
- Can I Use the Player ID Map in a Google Sheet?
- How Often Are Changes Made?
- Who Maintains the Player ID Map?
- I Downloaded One of Your Old Books. The Player ID Map Won’t Update. What’s the Deal?a
What Is the Player ID Map?
The MLB and fantasy baseball landscapes are wide reaching. We fantasy players gather information, projections, and opinions from many locations. Any time you have a situation like this, where data is coming from many disparate places, some form of “mapping” table can help connect the dots and data points from these different sources.
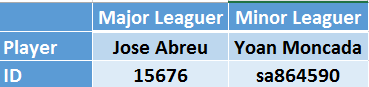
If you’ve ever tried to line projections from Fangraphs up with projections from Baseball Prospectus, Mastersball, or Baseball HQ, you’ll understand this challenge. You may have tried a VLOOKUP in Excel or Google Sheets to line the data up side-by-side. But player names are not a great mechanism to do this. Names can change (see Nick Castellanos and Nicholas Castellanos or B.J. Upton and Melvin Upton). Name conventions can differ between sites (see A.J. Pollock and AJ Pollock or Ronald Acuna and Ronald Acuna Jr.). Even worse, there are occasionally duplicate names (Chris Young being a recent example).
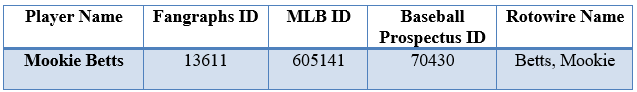
The Player ID Map solves these discrepancies. It enables an owner to line up an A.J. Pollock in their spreadsheet to an AJ Pollock from projection system. The Player ID Map is the bridge that has enabled me to build tools like the Projection Aggregator and the Automated SGP Ranking Tool. It enables building spreadsheet tools and other solutions that can work with or link to major sports websites (ESPN), projection systems (Steamer, Razzball, Mastersball, ATC), and fantasy baseball providers (NFBC, Fantrax, Yahoo!, Draftkings).
What Versions of This Tool are Available?
All the different “versions” below are pointing to the same source information. They are just different formats of using or viewing the data.
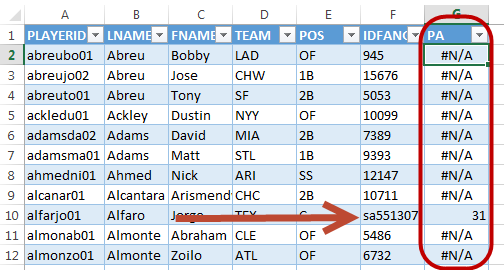
- Excel Version (LINK) – A downloadable Excel file that can be incorporated into your own fantasy baseball spreadsheets. The data in this file contains connections to the main version I maintain in an online Google Sheet. This version will likely be out of date when it is downloaded, but instructions on how to refresh the data through the connection to the Google sheet are easy-to-follow and are included later in this post. The Excel version contains two tabs:
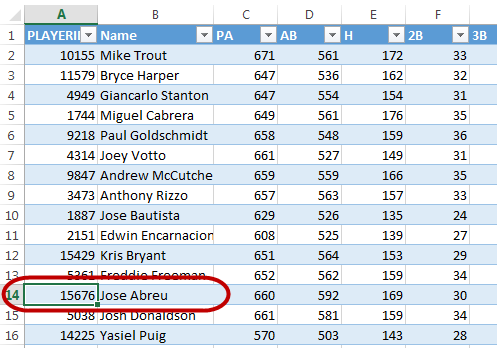
- PLAYERIDMAP – All available IDs and naming system information that I track
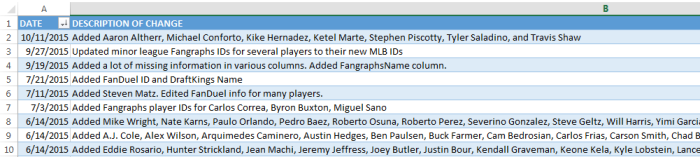
- Change Log – Explanations of changes made, including additions, corrections, and dates these changes were made
- Web Version of PLAYERIDMAP (LINK) – A live look at the html/web-based version of the PLAYERIDMAP tab in the live Google Sheet. You might use this if you just want to see the Player ID Map or look for specific pieces of information
- CSV Version of PLAYERIDMAP (LINK) – A one-time CSV download of the Player ID Map tab of the live Google Sheet. I wouldn’t really recommend using this because there is no connection back to the live data I maintain, like in the Excel version. But it could be used if you only need an easy-to-use one-time dump of the data.
- Web Version of Change Log (LINK) – A live look at the html/web-based version of the Change Log tab in the live Google Sheet. This could be used to review recent changes to the central Sheet and determine if a refresh is needed.
- CSV Version of the Change Log (LINK) – I have no idea why I make this available. Seems like it wouldn’t be valuable at all! But it’s here if you need it. It’s a one-time CSV download of just the Change Log tab.
How Do I Update or Refresh the Player ID Map?
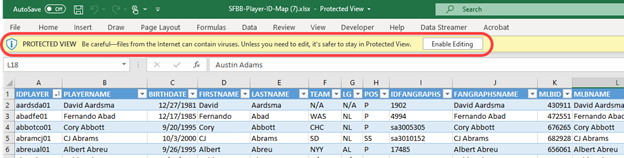
Note, you will be prompted about the potential danger of downloading Excel files from the internet the first time you download and open the Player ID Map. There are no dangerous macros or harmful code embedded in the file. It does maintain a connection back to my Google source file to enable you to download updated information. Click “Enable Editing” to accept this reminder and be able to interact with the Excel file.
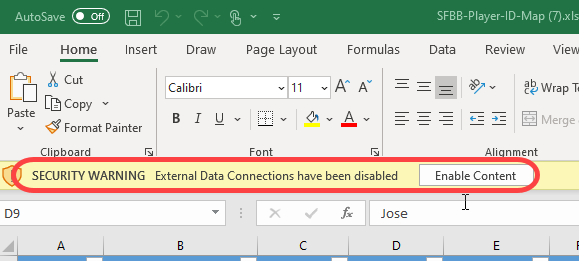
You may at times also see an Excel warning that external data connections can be harmful. These are common warning messages and good reminders that you do have to be careful what you download on the web. Click “Enable Content” to allow the data connection to pull in refreshed player ID data.
If you trust me and do download the Excel file, here’s how to refresh it.
| Step | Description |
|---|---|
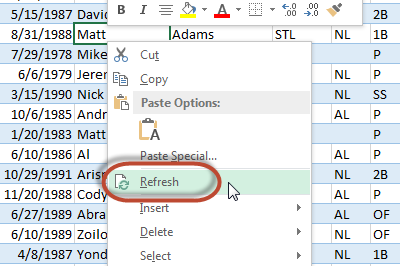
| 1. | Select a cell inside of the player ID data. It does not matter which player or piece of data. It just has to be something inside the blue and white table.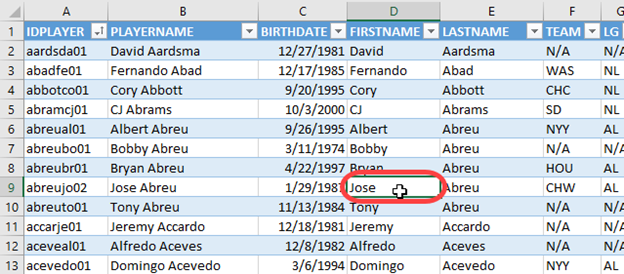 |
| 2. | Right-click on the selected cell and choose the menu option to “Refresh”.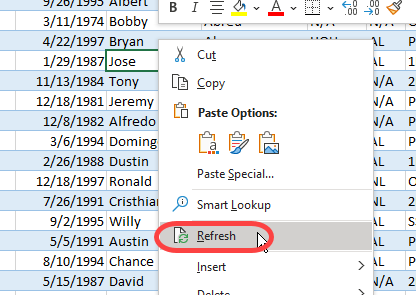 |
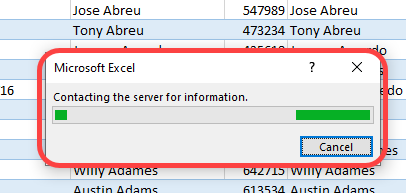
| 3. | You will begin to see various status messages as Excel begins to refresh the connection. You may see information being relayed in the bottom right of Excel. 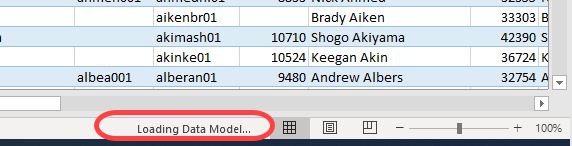
A popup may appear. And status information may even appear in the bottom left of Excel (I couldn’t grab a screenshot quick enough). The entire refresh may take 60 seconds or so. And it may depend on how much time has transpired since your last update. You don’t really get a “This is Done!!!” message. You’ll just know you’re ready to proceed when all the statuses stop changing. |
Origin
I created the Player ID Map in 2013. I started my ID map largely from information from Tim Blaker’s map. Tim continues to provide updates in his mapping file, but our maps have different purposes. I needed the flexibility to add new names and systems and not be reliant upon someone else. But I continue to use Tim’s map as an input to mine when I’m performing major updates for new players that enter the baseball world.
The Player ID Map has grown since 2013. I continue to add new systems, new name formats, and even new information about each player that will help me provide spreadsheet tools the the SFBB audience.
Do People Really Use This Thing?
I’m surprised at how often it’s used. At the time I write this article, the file has been downloaded or refreshed over 280,000 times (Who knows. 200,000+ of them could be me tinkering in spreadsheets). If I could only figure out a way to charge ten cents each time it’s used…
It’s an integral part to building long-lasting and flexible fantasy baseball spreadsheets that can take advantage of many different sources of baseball data.
Does the Player ID Map Include All MLB Players?
No. The tool is intended to be used for fantasy baseball purposes. Accordingly, the goal is to include only “fantasy relevant” players. That’s a purposely vague threshold. In the preseason, I generally keep the top 750ish players accordingly to NFBC ADP included in the Player ID Map. This should be enough players to cover most normal leagues. It’s possible the Player ID Map will not be deep enough for your 20-team NL-only league, your AL Central-only league, or your middle-reliever contest. Keep reading for advice on how to get more players added to the Player ID Map.
Continue reading “Everything You Need to Know About the Player ID Map”