Descriptive Statistics – discussed in Module 1, characterize data, dispersion, central tendency (baseball analytics)
Inferential Statistics – use a sample of the population and draw inferences about the whole population (projections)
Law of Large Numbers – as sample size goes up, the sample estimate gets closer to the population estimate
Calculating sample size is more of a statistical focus than this course. Factors are z score, standard deviation of the population, and margin of error
If z score goes up, sample size goes up
If SD goes up, sample size goes up
If margin of error goes up, sample size goes down
Russell Carleton (pizzacutter) study in 2007 todetermine how long baseball stats take to normalize (stay consistent with each other)
Plotted Batting Average in odd at bats vs. Batting Average in even at bats
Wanted R^2 of at least 0.50
Sabermetrics
WAR
Wins Above Replacement
Statistical framework for total offense and defense contributions that reflects performance and playing time
Variations
WARP (Baseball Prospectus)
fWAR (fangraphs)
bWAR / rWAR (Baseball Reference)
oWAR (Open source WAR)
Components:
Replacement level
Runs to Wins
Runs Estimators
Morris Greenberg has studied the three main variations of WAR
Cannot predict any WAR measure just by knowing another alternative WAR calculation
The three variations do not have a relationship to each other
The three methods are probably assigning different values of wins for hitter production
Increased playing time leads to a greater variance between the three measures (amplifies the differences)
Hitters who play 2B, SS, CF have more variant outcomes than other positions, meaning these positions have different variations in fielding calculations
There are also more variation for pitchers in the extremes (the top and the bottom pitchers). Probably due to how the systems attribute pitcher outcomes to pitchers versus defense.
Basis framework of calculating WAR is to use the pythagorean calculations and extending out the calculation to become: W/L = (R/RA)^2
Instead of squaring this calculation, you can try todetermine the best exponent to use (instead of 2)
For 1901 to current, the best fit exponent is 1.863
Technology
Park Factor = 100 * ((homeRS+homeRA)/homeG) / ((roadRS+roadRA)/roadG)
Anything over 100 is above average, below 100 is below average
Can use this same formula for any batting statistic
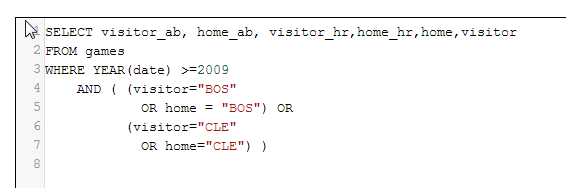
This SQL query on the retrosheet game log can help you calculate it for teams (this one is doing a HR park factor)
R Studio
lm() – fitting linear models
function(arglist) expr
return(value)
Build functions to create automated method of recalculating things you would commonly like to reperform
SQL
CASE
WHEN (expression)
ELSE
END
History
George Lindsey
Canadian, University of Toronto, WWII, PhD from Cambridge, Nuclear Scientist
First work, in 1959, was a look at batting average and if it could be used to predict future performance.
Concludes there were too many variables at play (differing pitchers, parks, situations, leagues, etc.).
Conducted a study of same-sided batter-pitcher matchups and found a statistically significant result that an advantage exists for opposite handed hitters
First published statistical study of L/R batting splits
Also first published look at run scoring expectancy in bases loaded situations
Was trying to figure out if you should try for a force out at home in bases loaded situations or if you should try for a double play
2nd paper, Progress of the Score During a Baseball Game
Isthe probability of scoring in any half inning the same? Is run scoring by inning homogeneous?
1st (high), 2nd (low), 3rd (high) are different from mean
Likely due to structure of batting order
Does the history of scoring affectsubsequent innings? Is scoring independent?
Large run scoring seems to not be independent
Lead changes follow a model of independence, meaning there is no tendency to overcome leads
Studied home field advantage (54%)
3rd paper, An Investigation of Strategies in Baseball
Tries to address steal a base or not to, sacrifice bunt with less than 2 outs, IBB when 1st base is open, etc.
The most important runs (in terms of affecting win probability) are those that tie the score or put you 1 run ahead
Analyzed all base states and the probability of scoring 0, 1, 2 runs. Also looked at the expected runs for each situation.
He uses these expectations to determine optimal strategy (if you bunt in this situation, what does it do to your expected runs?).
If you are in a specific situation and then you hit a triple, what happens? What happens to your expected runs in the new situation? How much does it increase from before?
The beginning of linear weights
A value added approach of measuring a player
Concludes IBB is not useful except for winning by one run and runners on 2 and 3 (the likelihood of scoring 0 runs increases by actually loading the bases, but the overall expected run value of this goes up too)
Concludes to always play double play depth with a runner on 1st, except with a runner on third that would tie the game/take the lead
Concludes sacrifice play does not improve scoring chances.
Concludes stolen bases value is dependent upon an individual’s success rate
We use cookies to ensure that we give you the best experience on our website. If you continue to use this site we will assume that you are happy with it.