
Welcome to part two of our dive into PITCH f/x, a source of data you can use to take your analysis of pitchers to the next level. In this installment, we’ll look more closely at the specific types of information that can be applied to fantasy baseball analysis.
In case you missed it, part one of the series covered an introduction of the PITCH f/x system, an overview of the types of information provided, and the best resources on the web to review PITCH f/x data.
Pitch Types
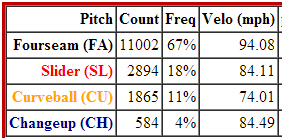
When doing analysis of PITCH f/x data, you will run across a system of abbreviations to classify pitches into different pitch-types. For example, a player card for Clayton Kershaw at BrooksBaseball.net would display (among many others) the following pitch percentage chart:
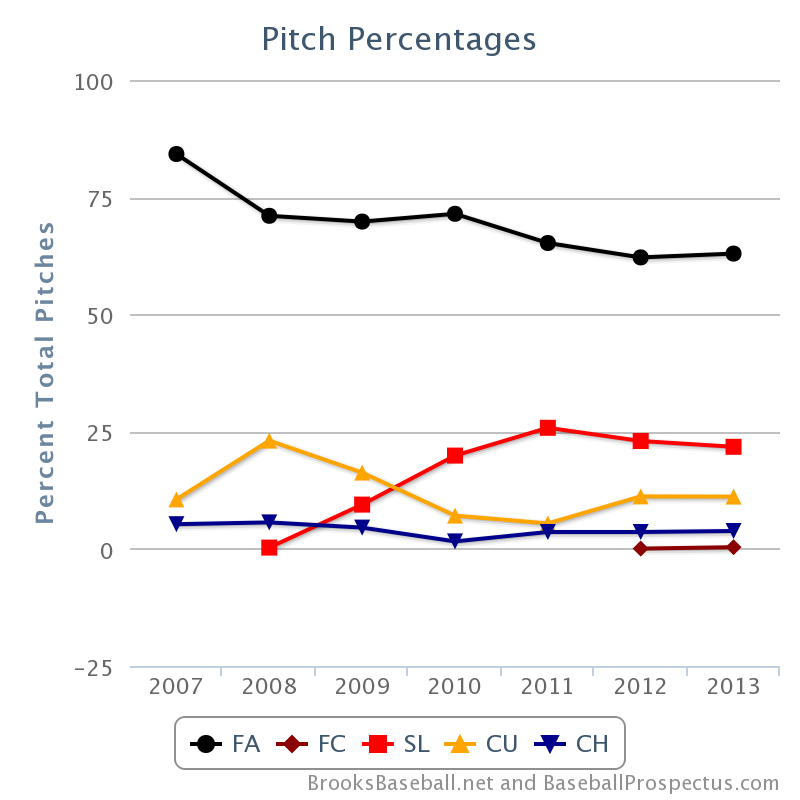
The abbreviations FA, FC, SL, CU and CH stand for Fastball, Cut Fastball, Slider, Curve, and Changeup. You might have figured many of these out, but the following table lists all abbreviations and their related pitch-type:
| Abbreviation | Pitch Type |
|---|---|
| FA | Fastball |
| FT | Two-seam Fastball |
| FC | Cut Fastball (Cutter) |
| FS | Sinking Fastball / Split-Fingered (Splitter) |
| FO | Pitch Out |
| SI | Sinker |
| SL | Slider |
| CU | Curveball |
| KC | Knuckle-curve |
| EP | Eephus |
| CH | Changeup |
| SC | Screwball |
| KN | Knuckleball |
| UN | Unidentified |
Pitch Velocity
Each player card at BrooksBaseball.net is usually clearly labelled with “mph” in the header.

When using the PITCH f/x data at Fangraphs, note that velocity statistics have a “v” prefix (vFA is Fastball Velocity, vCU is Curveball Velocity, etc.). This table at Fangraphs can easily be sorted by velocity to see the hardest throwers.
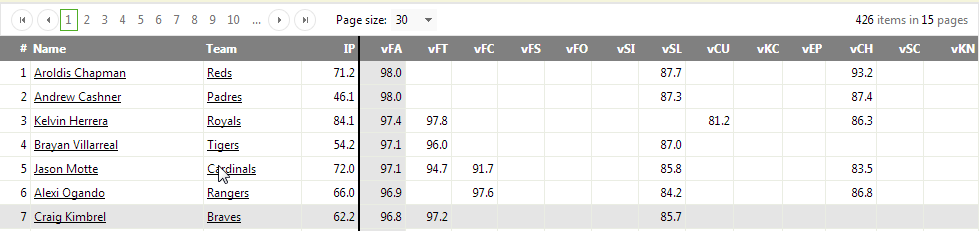
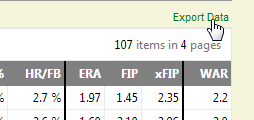
And remember, Fangraphs data can be exported into a csv file for use in other analysis.
 Pitch Outcomes – BrooksBaseball
In addition to tracking the pitch-type and velocity, the outcome of each pitch is tracked. BrooksBaseball.net breaks down balls and strikes by pitch-type (called strike or swinging strike). Swings are then broken down into balls put in play (BIP), fouls, and swings and misses (whiffs). Finally, balls put in play (BIP) are then divided into ground balls, line drives, fly balls, and popups.
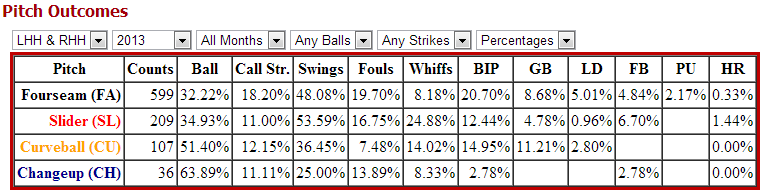
I believe there must be some pitch outcome results that are unknown, because the math doesn’t always work out in these tables. Take the chart above, for instance. For any pitch type, the ball percentage, called strike percentage, and the swing percentage should add up to 100%. A hitter can either have a ball called, a strike called, or they can swing. But 18.20% + 48.08% + 19.70% = 98.50%. Similarly, when the batter swings, the outcomes can be a foul, a swing and miss (whiff), or the ball in play (BIP). But for the fourseam fastball, 19.70% + 8.18% + 20.70% = 48.58%, not the 48.08% swing percentage. Outside of some inconsistencies like this, the data is great.
Sabermetric Outcomes – BrooksBaseball
The Sabermetric Outcomes table provides some very useful figures for analysis. The “Whiff/Swing” figure tells what percentage of time a player misses when they decide to swing. This can indicate if a pitcher has “swing and miss stuff”. You can look at this trend over time to see if strikeout skills are improving or deteriorating. It may also indicate that if a pitcher were to change his pitch mix/composition, that a change in strikeouts might occur. For example, if you see that Kershaw is begins to throw more or less sliders, his best “swing and miss” pitch at 42.38%, his total strikeouts might be more significantly affected.
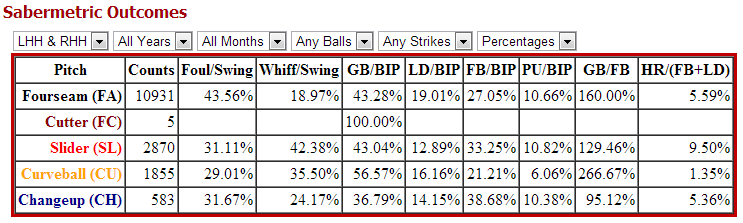
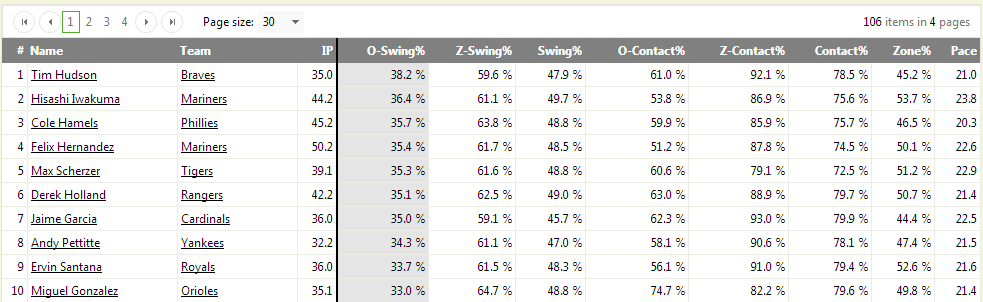
Plate Discipline – Fangraphs
On the Fangraphs pitching leaders page, it’s possible to view a “Plate Discipline” breakdown PITCH f/x data .

The plate discipline statistics will contain some measures relevant for fantasy baseball like the frequency of swings at pitches outside the zone (O-Swing%), frequency of swings at pitches inside the zone (Z-Swing%), and the frequency a batter makes contact with a pitch inside the strike zone when they’ve decided to swing (Z-Contact%).
 Thanks, and Stay Tuned
You now know how to locate PITCH f/x data and do some basic analysis. More specifically, you know how to view pitch mix/composition, you know how to read the pitch type abbreviations, how to locate pitch outcome data, and how to download certain reports for use again later on.
In an upcoming post we’ll take a look at a real-life example of how to use this data for player analysis.
Be smart.


