
I’m a firm believer that a key to happiness and success in life is to find a level of balance. A balance between work and life. Between spending money and saving money. Between eating healthy and eating ice cream smothered in hot fudge, whipped cream, and chocolate chips. Life is a tight rope that we’re constantly walking on. If you find yourself leaning too much in one direction, you’ll fall from the tight rope.
Finding Balance In BaseBall Analysis
If you’ve read Moneyball, done much reading about the current wave of Sabermetrics, or if you watch MLB Now (see video below) you’re aware of the ongoing debate between the believers in statistical analysis and the believers in scouting.
In reality, this battle is being waged only by a minority of folks vehemently against the use of analytics. It seems that the majority of “analysis” believers understand the optimal strategy is a balance of both analysis and scouting.
A Similar Battle In Fantasy Baseball
We must fight a similar battle for balance in doing research for fantasy baseball. News articles, baseball announcers, and even main stream fantasy baseball publications will frequently sprinkle anecdotal evidence into their analysis. Player A is “in the best shape of his life” (do a Twitter search for #BSOHL during spring training, you won’t be disappointed). Player B has a new batting stance. Player C is throwing a new pitch.
There is value to be found in some of these comments. But the difficulty lies in how to identify the valuable information from the fool’s gold.
Changes In Process
As a frequent listener to the Towers of Power Fantasy Hour: The Baseball Prospectus Fantasy Podcast, Jason Collette frequently uses the phrase, “a change in process”.
Link to the Towers of Power podcast in iTunes: 
On the MLB.com Fantasy 411 Podcast, Cory Schwartz frequently asks the questions, “what is different here” or “what has changed” (Schwartz usually acknowledges that he took this line of thinking from Jason Grey, but I can’t locate a resource in which Grey uses/shares this approach. From what I can tell, Grey now works for the Rays and has a protected Twitter account.).
Link to the Fantasy 411 podcast in iTunes:
This is the information to be looking for. A new batting stance. A new approach at the plate. A new pitch. A new delivery. A new pitch mix.
Using Collette’s, Swartz, and Grey’s line of thinking, when a player changes the underlying process of their swing or their delivery, it is reasonable to expect a change in results. Outside of such a change, changes in performance are likely just attributable random fluctuations in luck (and should regress toward the mean).
The Weakness in a Purely Analytical Approach
If you were to just use analytic tools to research player performance, you would likely miss some of these important changes. You might realize a change in performance only to pass it off as an aberration of luck. Or you might start to give statistical credence to a change significantly after the fact.
Analysis + Anecdotal Evidence = A perfect Marriage
The optimal strategy for fantasy baseball analysis is to find balance between statistical and anecdotal evidence. You don’t need to follow up on every little tidbit you come across. But train yourself to look for changes in a player’s process that might yield a change in their output.
Recent Examples
To demonstrate that changes do happen and can lead to improved results, here are some examples:
- At the end of the 2009 season, Jose Bautista changed his swing and soon became one of the most dangerous power hitters in baseball.
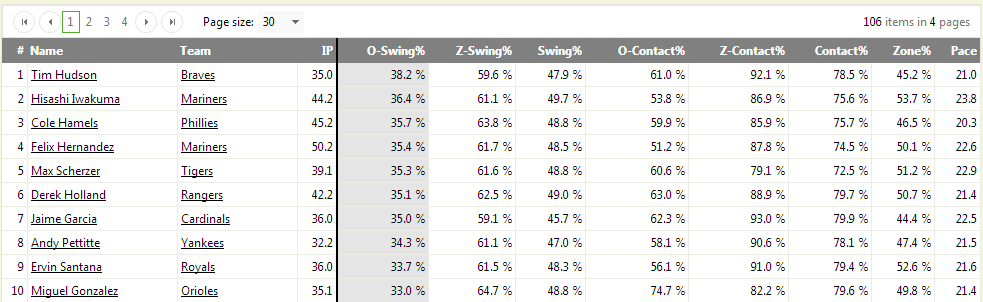
- Prior to the 2012 season, Austin Jackson changed his batting stance by significantly reducing his leg kick. While we can’t say the leg kick is solely responsible for the improved results, Jackson cut his strikeout rate from 27.1% in 2012 to 21.7% in 2013.
- Not all changes result in success. Before the 2013 season, Adam Dunn was informed that he was 12-f0r-102 with 65 strikeouts while facing a full count the season before. So he attempted to change his plate approach during spring training and early in the 2013 season to be more aggressive early in the count. While his approach did change, the results were poor.
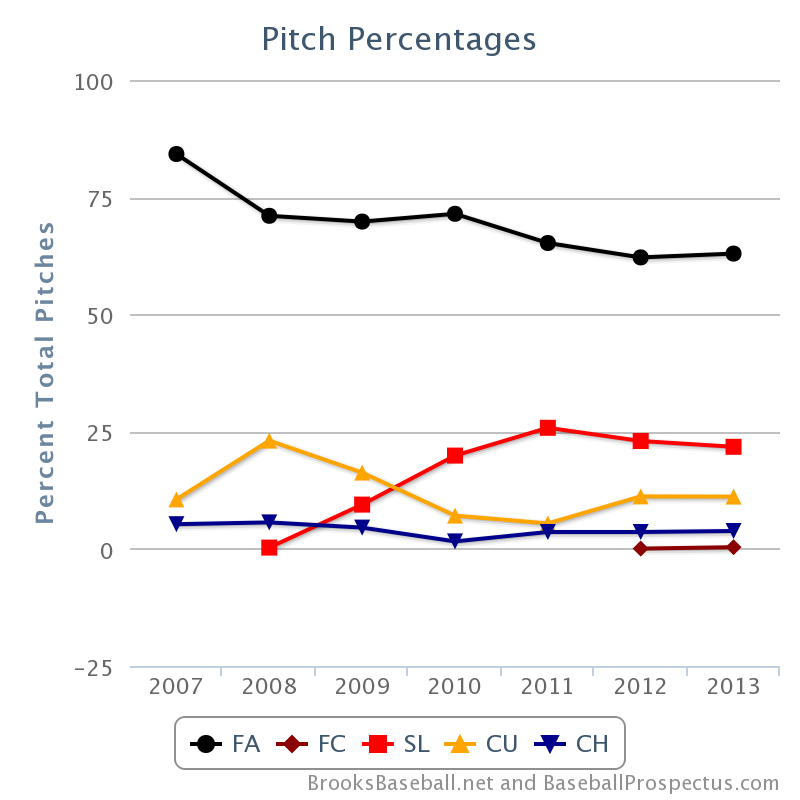
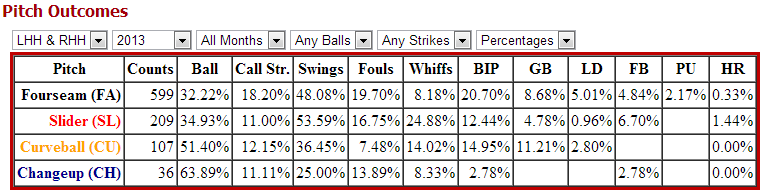
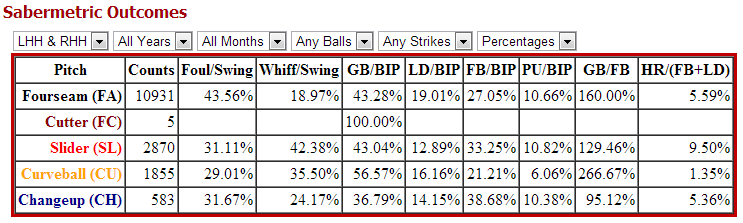
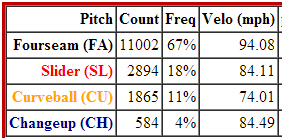
- After being traded to the St. Louis Cardinals during the 2012 season, Edward Mujica dramatically changed his pitch mix. Prior to the change he had a propensity to give up home runs and his move to the closer role had many concerned. But he’s been effective thus far and continues to increase his use of the pitch.
Homework
As you read MLB news and watch games, be on the look out for information that might indicate a change in a player’s process. Another reason why it pays to be knowledgeable about “baseball news”, and not just “fantasy news”.
Make smart choices.


