Archives by date

You are browsing the site archives for April 2013.

Smart Elsewhere #3 - Brett Talley on Exploiting Matchups to Increase Stolen Bases

Smart Elsewhere #3 – Brett Talley on Exploiting Matchups to Increase Stolen Bases

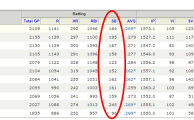
Take a look at the final standings in one of my leagues last year:

SmartElsewhere3

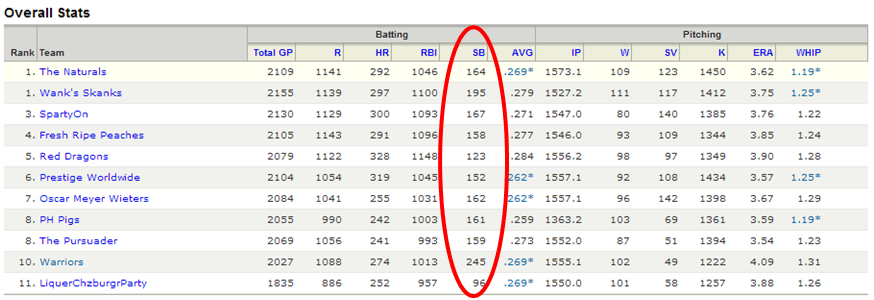
Note the tie for first place.  And then note the closeness amongst the teams in stolen bases.  Teams finished with 158, 159, 161, 162, 164, and 167.  If the team at 158 could have squeaked out 10 extra steals, they could have conceivably earned five extra points in the standings.

In this edition of Smart Elsewhere, Brett Talley (follow Brett on Twitter), a writer for the Rotographs pages of Fangraphs, takes a look at an approach you can use to try to squeak out 10 extra steals over the course of the year in his article, “Pitchers and Catchers to Exploit, Avoid When Chasing Steals

The article identifies pitchers, with more than 100 IP the last two seasons, that are most/least successfully stolen on (both a measure of frequency of steals and successful steal attempts).  The article then goes on to identify catchers with over 1,000 innings caught the last three years and the highest/lowest caught stealing percentages.

I like the applicability of this in both season-long rotisserie leagues allowing daily transactions and weekly head-to-head rotisserie leagues.  I’m not suggesting it’s necessary to check this list daily and start “streaming” base stealers against pitchers, but I see it as a way to squeak out a few extra steals over the course of the season or in a weekly head-to-head match up.

You can look up 2013 stolen base and caught stealing data by catchers on Fangraphs here or at Baseball Reference here.  And the stolen bases attempted and allowed by pitchers on Fangraphs here or at Baseball Reference here (Baseball Reference has information on stolen bases and caught stealing by pitcher, I can only find stolen bases on Fangraphs).

As an example of how to implement this, let’s say you have a decent base stealer on your team but on a typical day he doesn’t crack your starting line up.  He’s mostly sitting on the bench for depth.  But then you notice he’s got a match up against Edinson Volquez (7 SB allowed in 25 IP) and Nick Hundley (14 SB allowed in 19 G).  You can put your base stealer in the lineup and take out someone facing a difficult opposing pitcher.  Or vice versa, if you have a  stolen base specialist that usually is in the lineup, but is going against Johnny Cueto (whom Talley shows as the hardest pitcher to run in by a long shot), maybe you consider taking him out for the night and putting in a bench player with a game in Coors Field.

Updated tables for the current season, through April 29th, are below.

Want more tips and strategy advice like this?  Please click the follow button below.  Make smart choices.

Rk Player Tm G Inn SB ▾ CS CS%
1 Roberto Hernandez TBR 5 30.2 7 0 0%
2 Edinson Volquez SDP 5 25.1 7 1 13%
3 Clay Buchholz BOS 5 37.2 6 0 0%
4 A.J. Burnett PIT 6 35.0 6 0 0%
5 Cole Hamels PHI 6 37.2 6 2 25%
6 David Price TBR 6 38.0 6 2 25%
7 Chris Resop OAK 13 11.0 6 0 0%
8 Scott Feldman CHC 4 20.2 5 0 0%
9 Brad Peacock HOU 5 21.1 5 0 0%
10 Julio Teheran ATL 4 23.0 5 0 0%
11 Blake Beavan SEA 6 18.1 4 1 20%
12 Joe Blanton LAA 5 26.2 4 0 0%
13 Edwin Jackson CHC 5 28.1 4 0 0%
14 Tim Lincecum SFG 5 29.2 4 0 0%
15 Zach McAllister CLE 4 23.0 4 0 0%
16 Chris Sale CHW 5 33.0 4 0 0%
17 Evan Scribner OAK 8 12.2 4 0 0%
18 Jamey Wright TBR 10 10.1 4 0 0%
19 Dylan Axelrod CHW 5 27.1 3 3 50%
20 Josh Beckett LAD 5 30.1 3 1 25%
Provided by Baseball-Reference.com: View Original Table
Generated 4/29/2013.
Rk Tm G Inn SB ▾ CS CS%
1 Tyler Flowers CHW 20 170.0 16 3 16%
2 J.P. Arencibia TOR 22 191.0 15 2 12%
3 Welington Castillo CHC 19 163.0 14 7 33%
4 Nick Hundley SDP 19 166.1 14 4 22%
5 Chris Iannetta LAA 20 171.1 13 1 7%
6 Jose Molina TBR 19 129.1 13 4 24%
7 Carlos Santana CLE 15 123.1 13 2 13%
8 Alex Avila DET 17 151.2 12 4 25%
9 Jason Castro HOU 20 162.2 12 3 20%
10 John Jaso OAK 16 127.0 11 2 15%
11 Russell Martin PIT 22 178.0 11 6 35%
12 Buster Posey SFG 22 179.2 11 5 31%
13 Jarrod Saltalamacchia BOS 17 144.0 11 0 0%
14 Gerald Laird ATL 8 69.0 10 1 9%
15 Jose Lobaton TBR 13 89.1 10 1 9%
16 Jesus Montero SEA 14 128.1 10 0 0%
17 A.J. Ellis LAD 19 167.2 9 8 47%
18 Salvador Perez KCR 21 174.2 9 3 25%
19 John Buck NYM 22 178.2 8 5 38%
20 Erik Kratz PHI 21 161.1 8 4 33%
21 Yadier Molina STL 23 209.1 8 3 27%
22 Dioner Navarro CHC 6 50.0 8 3 27%
23 Derek Norris OAK 14 104.0 7 0 0%
24 David Ross BOS 9 79.0 7 3 30%
25 Kurt Suzuki WSN 19 159.0 7 2 22%
Provided by Baseball-Reference.com: View Original Table
Generated 4/29/2013.

Long-Term Thinking – Being Two Steps Ahead of Your League

Just as there will always be people searching for panacea weight loss pills, there will always be fantasy baseball players looking for simple fixes.  Some will fall victim to the hype machine (picking up every minor league call up with an iota of name recognition) and others will chase stats (picking up the bench player that hit three home runs last week, or my favorite, picking up a random long reliever that lucked into a save the night before due to pitching several innings in a blow out win).

And just as a long-term weight loss plan based on the fundamentals of exercise and diet is more likely to be successful than a pill, fact-based fantasy research and long-term thinking will be more successful than pursuing the flavor of the week.

Even better is a fantasy approach that will allow you to identify the “future flavors of the week” and pick them up before others even think to.  There’s nothing worse than having worked hard to stock your team’s “Watch List” only to be outraced by vulture league mates with Twitter access and quick trigger fingers.

Stacking The Odds In Your Favor

I prefaced this article with a discussion of the vultures.  But it’s not just the vultures you’re up against.  You probably have two or three other managers in your league that think similarly to you and value players consistent with you.

You’re in a competition for talent with 11 other managers.  Some skilled.  Some not.  It makes a great deal of sense to set your horizon of identifying future impact players just a bit further than everyone else in your league.

“Who will Be The Hot Pickup Next Week?”

This is the line of thinking to use.  I prefer this proactive approach in determining which player to pick up (who will be playing effectively in the near future) to a reactive approach (who was hot last week or who are the fantasy experts currently telling everyone to pick up).

How Do I Switch to This Proactive Approach?

To a large extent, reading and consuming fantasy baseball advice will lead to reactionary behavior.  While consuming this fantasy advice is a very valuable thing to do, in terms of valuing players and being aware of what others are likely reading or listening to, it usually involves news about what happened yesterday.  It is news about who is hot, who is cold, whose fastball has lost velocity, who got called up to the majors, etc.  It is updated rankings, it is “who would you rather have”.

You can see how the focus is on the past or present.  Again, some of this is good to know.  It can help your team.  It helps you know what others are thinking.  But to create an advantage, attempt to shift your focus to the future.

My recommendation is a simple one – Be very up-to-date on your major league baseball news.  Not your fantasy news.  Your MLB news.  Events in major league baseball are the driving force behind changes in opportunity and surroundings for players.

Baseball news precedes and drives fantasy news.

It’s pretty straightforward.  A team beat writer is going to get the news about a player losing his spot in the lineup before a fantasy writer.  The beat story might come out the night of the 21st.  That story has to reach the fantasy community who will then Tweet about it later that night.  They’ll then write columns about it on the 22nd, the next day.  And then on the 24th they might include the news item and some analysis in a weekly podcast.

And all the while, you could have received the news yourself and intelligently analyzed the fantasy impact.

Sources For MLB News

I get nearly all of my MLB news from two locations – Twitter and Buster Olney.

I follow a handful of MLB writers and then at least one beat writer from each MLB team.  To save you the trouble of identifying 30 beat writers and following them, you can check out the Smart Fantasy Baseball MLB News / Writers Twitter list (for more on Twitter lists and how to use them, read this).

I don’t necessarily read every tweet from each beat writer, but a few nights a week I might find myself scrolling threw the feed.  It would a waste of time to read everything…

That’s a big reason why I try to read Buster Olney’s (follow Buster on Twitter) daily column when I can (here’s a link to his blog at ESPN, you do need to be an ESPN insider to read it).  His daily column starts out with a feature story from the world of baseball.  And then he launches into a series of quick hitters about injured players, moves & deals, the previous day’s games, and then a series of articles for each division in baseball.  Each bullet has a link to a story on the web.  It’s great.  It’s efficient.  You can scan through the whole thing in a couple of minutes.

What You’re Really Doing

A player’s skills are not going to change dramatically in a short period of time.  So we’re really trying to identify changes in opportunity (playing time) and surroundings (new teams if traded, new spot in the lineup, etc.) for players.

Conclusion

Paying close attention to general baseball news can help shift your focus to a more proactive approach in identifying players to roster.  This will allow you to make moves before your leaguemates and lead to more well-thought, long-term, strategic decisions.

Thanks for reading.  Get Smart.


Economic Theory and a Major Mistake to Avoid

Let’s get nerdy and mix economic supply and demand theory with fantasy baseball. While not an economics expert, I think the “supply” part of the fantasy baseball equation can be thought of in two ways:

  1. An individual player – in which case the supply is fixed, there is just one player
  2. All of the players in the player pool (where the player pool could be all players, all second basemen, etc.) – in which case the supply can fluctuate as rookies enter into the player pool, players get hurt, players switch from the AL to the NL if you play in AL- or NL-only leagues

Let’s think about things from bullet 1, an individual player perspective, and apply this part of the supply and demand model:

If demand increases, a shortage occurs, leading to a higher equilibrium price.  If demand decreases, a shortage occurs, leading to a lower equilibrium price.

The statements above can be modeled with this graph below:

Supply-demand-P


Delving into a brief economics lesson, the price of a product (or player) is set at the point where the demand curve (red downward sloping curve) meets the supply curve (teal upward sloping curve).   In the picture above, the D1 demand curve crosses the S supply curve at the price of P1.

An increase in demand is illustrated by the red D1 curve shifting to the right to become the D2 curve.  Under this scenario, D2 crosses the S supply curve at the higher price of P2.

I Love the Colored Picture, But What Does This Have To Do With Fantasy Baseball?

I’m surely not considering everything that can affect a player’s demand, but I’ll group demand shifts into two categories:

  1. Real, factual, supported on-field events
  2. Artificial, unfounded, unsupported changes in demand

The first category would include events that truly do support a change in the demand of a player.  This would be things like a player getting injured (and decreasing demand), a minor league player getting called to the majors (and increasing demand), a player showing improved abilities and hitting/pitching better than expected (and increasing demand), a player performing worse than expected (and decreasing demand), or a player moving to a more favorable environment that should help their production (and increasing demand).

These events are real.  They can be measured to some extent.  We can see when players improve their skills, get more opportunity to play, or change their surroundings.

Because these are real and measurable, a change in the demand and valuation of a player makes sense.

But Many Changes in Valuation Are Not Founded

A major mistake I see from fantasy baseball players is to make adjustments in demand that are not related to these real measurable events.  Some examples:

  • Rookies and other young players are perceived as “cool” or “sexy”, and there is an artificial shift in their demand curves to the right because of this.
  • Older and aging players are perceived as the opposite, and there is an artificial shift in their demand curves to the left because of this.
  • A player gets pegged as a “sleeper” by the fantasy community, this takes on a life of its own, and causes a shift in the player’s demand curve to the right.

How To Take Advantage of These Situations

This definitely occurs.  There’s not a doubt in my mind.  It’s up to you to recognize when this is happening and sell or avoid players that are overvalued because of artificial shifts in demand, and when to buy or seek out players that are undervalued.

Current Examples Leading to mis-Valued Players

  • Mike Trout – He certainly had a magical season last year.  But do you know that he played two and half seasons in the minors and didn’t hit 30 home runs COMBINED in those three years?  He did hit 30 in his first major league season, but it seems like a bad idea to expect that again.
  • Mike Zunino – He’s being talked about like he’s the next great offensive catcher.  Who is the last young catcher to come into the major leagues and succeed?  I can’t name one.  
  • Paul Konerko – He’s the poster boy of the old, unsexy, but still very productive player.  Nobody wants Paul Konerko on their team.  BORING!  Well, do me a favor and go look at his career stat page.  He’s a machine.   And he was only the 18th ranked first basemen heading into the season.

You get the idea.  There are many more examples out there.  And the line between supported and unfounded changes in demand is gray and blurry.

The hot new trend in fantasy baseball analysis is to quote a pitcher’s velocity as if it is the determining factor in their success.  A few weeks into the season news has surfaced that C.C. Sabathia, Justin Verlander, and David Price are suffering from lost velocity.

On the surface, this sounds terrible.  And while the decrease in velocity is a measurable fact, it doesn’t necessarily indicate a loss in effectiveness.  After C.C. Sabathia’s first start, it was widely quoted that his fastball was several MPH slower than it was in 2012.    His career was over.  He was old.  He would never be the same.  In his next two starts he went out and threw 15 IP, allowed only one earned run, and struck out 13.

More pitchers facing lost velocity in early-2013: Matt Moore (29 strikeouts in 26 IP), Lance Lynn (34 strikeouts in 29 IP), and Max Scherzer (36 strikeouts in 24 IP).

Conclusion

Recognize when and why a change in demand has occurred.  You hear a lot of “buzz” about a player.  A player is being talked about on Sportscenter.  You hear someone say a “player’s career is over”.  Do the opposite of what the crowd is doing and you’ll come out ahead in the long run.

Thanks.  Stay smart.


Why I'm Not Buying Trevor Rosenthal (and Bought Mujica)

Why I’m Not Buying Trevor Rosenthal (and Bought Mujica)

Granted, Edward Mujica is probably owned in all leagues at this point, as he is now up to four clean saves.  But as recently as today, April 24th, a CBS update comes out saying Mujica “may not be a long-term solution”.  Mujica

Everything the update says is true.  But here are the reasons why I have invested in Mujica and why I think you should target him:

  1. He’s getting saves right now.  A bird in the hand is worth two in the bush.
  2. For his career, he has nearly a 5-1 strikeout-to-walk ratio.  
  3. Since joining the Cardinals* in 2012, he’s pitched 34.1 innings.  He has 29 strikeouts and four walks (over 7-1 strikeout-to-walk ratio).
  4. In those 34.1 innings, he has surrendered 2 home runs.
  5. *I realize this is an arbitrary point in time, and selecting arbitrary points in time can lead to misleading statistics.  But, it makes sense to do if there was a fundamental change in Edward Mujica after joining the Cardinals…  He’s not the same pitcher with the career 1.22 HR/9 ratio that detractors continue to bring up.  He has continually increased the use of his splitter the last few years.  And this great post at VivaElBirdos.com explains much more about Mujica’s increased usage of the pitch after coming to St. Louis.  Courtesy of BrooksBaseball.net‘s pitch data, here’s Mujica’s 2012 frequency by pitch type (notice the 45% splitters in the “Freq” column):
    Mujica1And here’s the data so far for 2013 (notice he’s only using three pitches now and using the splitter 59% of the time):
    Mujica2We’re still early in the season, but that’s a different pitch composition than in the past.
  6. There’s a lot of buzz about Trevor Rosenthal and his “stuff”.  His average fastball is 98mph.  He can hit 100 on the gun.  But between AA and AAA in 2012, he struck out 104 batters in 109 IP.  With all the talk about his dominating stuff, I would have figured he’d be over one strikeout per inning.
  7. I think the Cardinals have an incentive to keep Rosenthal in a middle relief role.  He can pitch multiple innings, if necessary.  He can still be converted into a starter, if necessary.  And with Jaime Garcia being at an elevated risk of injury (Garcia elects for rest and rehab instead), an additional starter may be needed.
  8. This is a bit of a long shot, but could be part of the equation.  Mujica is a free agent at the end of the 2013 season.  If he somehow walks away after earning 40 saves, he could be able to earn a nice contract.Under the new compensatory draft pick rules, if the Cardinals offer a contract of 1-year and $13.3 million (the 2012 threshold, amount will increase for 2013), and Mujica rejects the offer in order to become a free agent, the Cardinals get an extra draft pick.  And while it would be hard to imagine Mujica earning a contract worth more than $13.3 million in a single year, it wouldn’t be out of the realm of possibility to be offered a 3-year $20 million deal (Chris Perez makes $7.3MM, Jim Johnson $6.5MM, Brandon League signed a 3-year $22.5MM deal, Heath Bell a 3-year $27MM, Jeremy Affeldt has a 3-year $18MM deal).


Who are you buying or selling in the St. Louis bullpen?

Thanks for reading.  Stay smart.


Smart Elsewhere #2 – Carson Cistulli on Didi Gregorius and Tony Cingrani

A switch in the medium in this edition of Smart Elsewhere.  Having a long commute to work, I consume a lot of my baseball information via podcast.  On the 4/16/13 edition  of the “Eye on Baseball Rumors” podcast from CBSSports.com, Carson Cistulli (follow Carson on Twitter) joins Chris Cwik (follow Chris on Twitter) to discuss a couple of recent minor league promotions.

Click the button below to launch iTunes and be taken to the podcast page, then play the 4/16 episode.

Here are the highlights:

  • 13:00 – 18:05 minutes – Didi Gregorius’ abilities, his likelihood to stick in the majors (he should be competent defensively and offensively, his plate approach has improved, and he may be able to stick around if he can outplay Cliff Pennington) 
  • 18:05 – 24:50 minutes – Tony Cingrani’s pitching approach, his heavy reliance upon the fastball and pitching deception, and the likelihood he’ll succeed in the major leagues (there are very few starting pitchers who rely as heavily upon the fastball as Cingrani and have any measure of success, it will be very unusual if he is able to succeed for a long period of time)

I’ll warn you that Cistulli does not give his analysis from a fantasy baseball focus.  The analysis of Gregorius and Cingrani covers their skills and their “real-life” baseball merits.  But the information is great and can be applied to your own fantasy leagues.  The entire episode does run over 50 minutes.  Outside of the 11 minutes mentioned above, Cistulli briefly discusses Brett Lawrie and then goes more in depth into his work at Fangraphs and as a baseball writer.  

Cistulli is a writer for Fangraphs.com and the host of the  (link will launch iTunes and direct you to the Fangraphs Baseball podcast), which comes highly regarded as well (certain episodes at least, he’ll preface any episode with a disclaimer if it doesn’t contain baseball analysis).

As always, let me know what you’re reading or listening to.  Leave a comment below or shoot me a link on Twitter.

Keep making smart choices.

Examining S.O.S. – Surroundings

Having discussed the overall Skills, Opportunity, and Surroundings approach to fantasy baseball decision making, and breaking down the “Opportunity” component, let’s now focus on “Surroundings”.

Be Honest…

When you were preparing for your fantasy baseball drafts, did you even look to see what spot in the lineup players would bat?

The Importance of Batting Order

You know that Mike Napoli, Salvador Perez, and Jonathan Lucroy are catchers.  But do you know that Napoli bat and Perez bat clean up and Perez and Lucroy hits fifth.  They hit in the heart of the lineup on pretty strong offensive teams.  Matt Weiters and Carlos Santana have batted sixth most frequently.  Wilin Rosario usually hits seventh.

(Thanks to MLB DepthCharts at Baseball Prospectus for the current lineup information.)

If you didn’t catch Smart Elsewhere #1, it’s a great read.  The article by Tristin H. Cockroft (follow Tristan on Twitter) contains great statistics about the additional at bats a player gets by batting higher in the order and the additional production a player contributes by batting in the heart of the order.  Understanding and applying these concepts will help you squeeze more value out of your drafts and in season pickups.

Cockroft’s article notes that, on average, a cleanup hitter gets about 0.30 plate appearances more per game than a seven hitter.

That’s almost 50 more times to the plate over the course of the season (162 games * 0.3  = 48.6).  Even if player X is not as skilled as a player Y, he might outproduce player Y if he comes to the plate 50 more times.

If we approximate that a full-time starter would have about 600 plate appearances, an increase in 50 plate appearances is an increase of 8.33% (50 / 600 = 8.33%).  And an increase in plate appearances should have a direct correlation with increases in counting stats like runs, home runs, and RBI.  An 80 run, 25 HR, 90 RBI player instantly becomes an 87 run, 27 HR, 97 RBI player.

Compounding Effect

My numbers above only account for the increase in plate appearances.  But there’s more to the story.  Comparing a seventh hitter to a cleanup hitter, there will be an increase in production for the cleanup hitter due to hitting near better offensive players.  A seventh hitter will get solid RBI opportunities due to batting with the fourth, fifth, or sixth hitters on base.  But that seventh hitter will be less likely to score runs due to having the eighth and ninth hitters hitting behind him.

Not only will a fourth hitter will see more plate appearances than a seventh hitter, those plate appearances will be in more productive situations because of the better hitters surrounding the cleanup hitter.

The Hard Numbers

Taking into account the additional plate appearances and the better surroundings, according to Cockroft’s findings, a cleanup hitter averages 0.839 Runs + RBI per game (the combined total of runs and RBI, so nearly one RBI or one R per game).  A seven hitter averages 0.652 Runs + RBI per game.  That difference is 0.187 R+RBI per game.  Over the course of a 162 game season, that is over 30 more Runs/RBI per game.

Other Components of “Surroundings”

Position in the batting order is a significant piece of the surroundings factor.  Others to consider are:

  • Lineup Strength – Cockroft’s article also gives specifics about the additional plate appearances and run production created by playing for a top offense as opposed to a poor offense.  A cleanup hitter for a top five offense can be expected to have 0.971 Runs + RBI per game; whereas a cleanup hitter for a bottom five offense can expect only 0.737 Runs + RBI per game.
  • Park Factors – Certain Major League parks allow for more run scoring than others.    The factors on this ESPN page show the 2012 park factors for run scoring.  I believe the phrase “park factor” can mean different things to different people, but for ESPN a factor of 1.000 would mean that a team would be expected to score the same amount of runs playing home games in a park as they would if they were playing on the road.
  • AL vs. NL – I haven’t found any hard data that gives specific details about the differences between the two leagues, but we know it’s easier for pitchers in the NL.  At the very least, facing a pitcher every 9 batters is a huge advantage.
  • Injuries – I decided to group injuries in the “Surroundings” category.  There’s an argument to be made that staying healthy is a skill (and belongs in the “Skills” category).  Or that being injured reduces your “Opportunity” to play.  But I view surroundings as outside forces that affect a player’s performance for the better or worse.  Being injured or being healthy certainly affect performance.  When you consider the scenario that players will play hurt but not miss time, I think raw “Skills” are not affected.  Rather, it’s an outside factor causing a drain on performance.
  • Contract Status – Whether or not you believe a player in a contract year will perform better than when not in a contract year, it’s still something to consider.  And contract status can also affect a player’s opportunity.  A team is likely to stick with a struggling $15 million /year player than they are to stick with a struggling player with remaining minor league options.

Conclusion

Monitoring where your hitters are hitting in the lineup and targeting those hitting high in the order is a great way to give your team a slight edge.  When you get to the end of a rotisserie season and it’s only several runs or several RBI separating teams in the standings, think about how every at bat counts along the way.

Be smart.


Examining S.O.S. – Opportunity

Now that we have broken down the S.O.S. methodology, let’s dive into a closer look at the components.  I’ll skip over the “Skills” component of S.O.S.  I know.  You’re thinking, “Wow, Tanner.  Create a new three part methodology and you skip right over the first part.”

Yes.  You caught me.  But a main idea behind S.O.S. is that we are always thinking about the “Skills” component and we’re missing the “Opportunity” and “Surroundings” pieces.

Opportunity Knocks

Looking over the S.O.S. equation…

OUTPUT = SURROUNDINGS * (SKILLS * OPPORTUNITY)

…  remember that “Skills” can be thought of as what a player would produce in 162 games (or 32 starts).

Because we start at 162 games or 32 starts, the “Opportunity” adjustment can only decrease the base projection.  To the extreme, if a player has no opportunity to play, their 162 game output is reduced to nothing (you may recall from elementary school math that multiplying 35 possible home runs by zero playing time calculates out to 0 actual home runs).

Identifying “Opportunity” Information

News about opportunity will not come from fantasy experts first.  Fantasy Experts are going to read or hear the information from a Major League Baseball writer (like Buster Olney, Ken Rosenthal, etc.) or a team’s beat writer.  And not all news about opportunity will be picked up on or analyzed by fantasy writers immediately.  With this in mind, if you’re looking for a way to get a small advantage over your competition, you should be in tune with not only fantasy news, but general MLB news.  Click here for information on how to easily follow MLB experts, fantasy experts, and sabermetricians on Twitter.

Case Study

Look at these recent news items about the Toronto Blue Jays (you don’t need to read the links, just the headlines):

Besides the direct impact these news items have on Wells’, Reyes’, Lawrie’s, Bautista’s, and Kawasaki’s value, the cumulative effect of these stories has a potentially very big impact on another player.

You have to dig a little bit here.  But it sure seems like Emilio Bonifacio’s playing time is under attack.  The Blue Jays base-stealing star shortstop, Reyes, goes down with an injury.  Rather than replace Reyes with Bonifacio, another base-stealer who has played 80 games played at SS in his career, they elect to go with the .192 hitting (in 104 AB in 2012) Kawasaki.

Not only that, but there is an effort being made to shift players, All-Star players, all over the diamond.  Lawrie to 2B, where Bonifacio had played more games (9 at the time of writing) than any other position (5 in OF), and Bautista to 3B.

So they’re going to move Bonifacio to the OF, right?  Perhaps, but the signing of Casper Wells, the presence of Colby Rasmus, Melky Cabrera, Rajai Davis and Mark DeRosa might make playing time scarce.  And none of the news articles even mention Anthony Gose in the minor leagues.

You aren’t going to see a fantasy analyst write a big article about Emilio Bonifacio’s playing time.  I did see quite a bit of buzz about Lawrie and Bautista picking up position eligibity and how it affects their value.  But nary a mention of Bonifacio.  The point being that the analysts aren’t going to catch everything.  There is still room for your own critical thinking to create an advantage for you.

*After I came up with this case study to illustrate my point, Casper Wells was designated for assignment, Jose Bautista missed his fourth straight game with back problems, and Lawrie has only played 3B since his return from the DL.  But you still get the idea, right?  Perhaps Bonifacio won’t see his playing time affected.

Conclusion

There is an advantage to be gained by keeping up to date with MLB news and then by thinking critically about that news.  Take your thinking to the next level.  Who else does this affect?  What are the intentions behind this move?  What related move could be coming next?

Consume a lot of Major League Baseball news.  This will allow you access to additional news items that those who only read fantasy advice might not get.

Baseball news is also available sooner than fantasy analysis.  It may take hours or days for fantasy analysts to identify, analyze, and write quality content about an event or news item.

Thanks For Reading.

Stay smart.


S.O.S. – A Simple Approach to Making Fantasy Baseball Decisions

After two weeks of the 2013 season, John Buck is the fifth best hitter according to ESPN and CBS.  The Tampa Bay Rays are off to a 4-9 start and are already in last place and five games back in the AL East.  There is news that Brett Lawrie was playing second base in his rehab stint.

What Does All This Mean?

That’s a great question.  And in a minute I’ll introduce a methodology to think through what these facts mean. A main tenet of Smart Fantasy Baseball is to teach or illustrate ways to become better at the game.  One area to target for improvement is the ability to think deeper and more critically about pieces of news or a players skills and make well informed strategic decisions. I think we can all get better at doing this.  We’ve gotten a bit lazy.

I love Mathew Berry.

I think he’s hilarious.  I think he generally gives good advice.  But as fantasy baseball and football have gained popularity, Berry has been pushed to the forefront as the fantasy industry’s star.  He writes witty articles, he co-stars on an entertaining podcast, and he appears on SportsCenter where he must attempt to give meaningful fantasy advice in 60 second segments.

And this is how a large percentage of us fantasy owners get our research.  On the ESPN Fantasy Focus podcast, you’ll often her Berry say, “I like player X more than player Y.”  In fact, a staple of the show is the “Name Game” where a series of similar players are rattled off and Berry states whom he prefers among the group.

The “I like player X more than player Y” fantasy advice is a huge pet peeve of mine*.  The reason being, there is often little or no “why” attached to that analysis. Because of this, I think there is a huge opportunity to separate yourself from an average fantasy baseball player.

Slow down and think critically about the decisions you are making.

Enter the “S.O.S.” framework to evaluating a player.

Skills, Opportunity, and Surroundings

I believe there are three significant components to a player’s fantasy value:

  1. Skills – A hitter’s ability to hit for power, hit for average, and steal bases. A pitcher’s ability to strike out batters, prevent runs from scoring, and keep batters of the base paths.  These skills can be evaluated by any number of statistical measures; HR/FB, xBABIP, FIP, K/9, etc.
  2. Opportunity – Skills don’t matter if a player doesn’t get opportunity to play.  A player can be trapped in the minors, blocked by an All-Star.  Or they might play for a bad team that aggressively promotes players.  They might be on the Major League roster but trapped on the weak side of a platoon or in a crowded outfield, battling for playing time.
  3. Surroundings – Players don’t operate in a vacuum.  They play in the AL or the NL.   They play in the AL East or they play in the NL West.  They play in Coors Field or they play in Petco Park.     They hit in a good offensive lineup or they play for the Marlins.  They hit third in the order or they hit ninth.  They might be the topic of trade rumors.  Or they’re injured.

Each of these factors should be considered in analyzing a player, interpreting a news story, or before making a move.  It is easy to rush into an ill-advised transaction if you haven’t considered all of these different facets. Putting this in a more visual mathematical equation, I come up with this:

OUTPUT = SURROUNDINGS * (SKILLS * OPPORTUNITY)

“Skills” is a raw and rough estimate of a player’s statistical output.  For the sake of this example, we can set this equal to what a player would be worth if they played 162 games or made 34 starts.

This “Skills” figure is then multiplied by the “Opportunity” factor.  “Opportunity” can range from 0 – 1.  Meaning a player can have all the skills in the world, but if you multiply “all the skills in the world” by zero… you get zero.

This result is then multiplied by an adjustment for “Surroundings”.  An average or neutral set of “Surroundings” would set this factor equal to 1.00.  If the surroundings are beneficial to a player’s output (they are a hitter in a hitter-friendly park on a strong offensive team batting in the heart of the order), the factor grows larger than 1.00.  Maybe to 1.25.  If the surroundings are poor and harmful to a player’s output (they are a hitter with home games in a very pitcher friendly stadium, part of a weak lineup, and bat 8th), the factor falls below 1.00, maybe to .75.

Go The Distance

If you build it, they will come.  Alright, enough Field of Dreams quotes.  But the point is to “go the distance” with your analysis.  We all fall victim to just considering a player’s skills in the equation above and don’t make the necessary adjustments for opportunity and surroundings.

More To Come

Stay tuned to Smart Fantasy Baseball for a more detailed discussion of how to apply S.O.S. and “case studies” using some real news items from the young 2013 baseball season. Please follow SmartFantasyBB on Twitter or subscribe to the blog using your e-mail address in the sign up box on the top right of any page.  Once you sign up, you’ll get any new post e-mailed directly to you.

Thanks for the follow

Be Smart.

*NOTE:  I repeat that I love Berry.  I “download and listen” to nearly every episode of the Fantasy Focus podcast.  I’m certain he understands advanced baseball metrics and applies them to his analysis.  Heck, he’s a member of the Fantasy Sports Writer Hall of Fame.  But he’s a celebrity.  His hands are tied because of the audience he serves (the masses) and the medium uses to relay his message (in working for ESPN he has to quickly get out his message).  He can’t delve into 15-minute long explanations about FIP and BABIP.

Smart Elsewhere #1 – Do You Know Where Your Players Bat in the Lineup?

Welcome to the maiden post in the “Smart Elsewhere” series.  In post number one, ESPN’s Tristan H. Cockcroft discusses the “Fantasy value of lineup positions” (follow Tristan on Twitter).  This is an incredibly insightful article about the benefit of loading your team with players that bat in the top four spots of the batting order.

It includes great statistics about the additional plate appearances players higher in the batting order receive, the great production drop off (in runs and RBI) that occurs the further down the line up a player bats, the effect of playing for a good offensive team, and how to think about the value of players who changed teams or positions in the lineup from last year.

Do you know where your players bat in the lineup?


Introducing “Smart Elsewhere”

The best thing you can do to become a smarter fantasy baseball player is pretty straightforward.  You need to read.  Read a lot.  Read articles from a lot of different sources.  And luckily, there are a lot of great writers and analysts out there.

I am going to begin a recurring series of posts, entitled Smart Elsewhere, in which I link to smart fantasy baseball articles written by others.  They may be current articles.  Or they may be old but still helpful at making you a better fantasy baseball player.

If you come across an article you think others can benefit from, mention it to @smartfantasybb on Twitter.  And if you’re not already, make sure to follow Smart Fantasy Baseball on Twitter by clicking on the button below.

Thanks for the follow and be smart.