Archives by date

You are browsing the site archives for August 2013.

Case Study - Weighted Average Probabilities and Ryan Braun

Case Study – Weighted Average Probabilities and Ryan Braun

Hindsight is 20-20.  We all know this.  And now that Ryan Braun has been suspended for his association in the Biogenesis scandal, it’s easy to to say that we overvalued Braun in our draft preparation.  But let’s look back to what we knew in the preseason and use this as a learning opportunity to apply a lesson in weighted average probability and expected results.

What Did We Know?

News surfaced in early 2013 that Ryan Braun and numerous other players were associated with Biogenesis.  Documents were obtained that showed an official link between the players and the clinic.   There was speculation that the players involved could face suspensions during the season.

We didn’t know much more than this.  Would players miss 50 games?  100 games? Would the suspensions come down during the 2013 season?  Or after?  Could MLB even uncover enough evidence to support suspensions?

What Could Happen?

For Braun, we could reasonably assume he’d be the target of a 100-game suspension. He was nearly the recipient of a 50-game suspension in the fall of 2012, but managed to avoid it on a technicality.  So new evidence could push him from a first-time offender to a second-time offender (and a 100-game penalty).

Let’s Start A Basic Projection For Braun’s 2013 Season

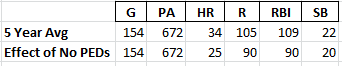
If we are to build a projection for Braun’s 2013 season, a reasonable place to start would be to look at career averages.  Braun played a partial season in 2007 and played at least 150 games in 2008-2012.  So let’s use these last five years of “full seasons” and figure out the average production as our baseline estimate:

WAP1

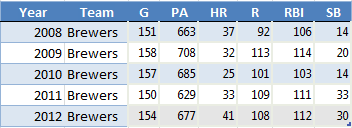
These average to 154 games, 672 plate appearances, 34 home runs, 105 runs, 109 RBI, and 22 SB.

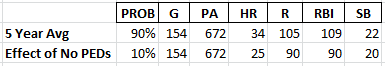
But What If This Isn’t An Average Season?

We know Braun was nearly caught as a PED user in 2012. So what if he was scared into stopping his use of PEDs?  Can we build this into our estimate?

We don’t have any scientific data to understand the exact effect of PEDs.  So let’s throw out a rough guess and say we think the effect of stopping the use of PEDs would slightly decrease his production.  We’ll say his numbers would remain at 154 games and 672 plate appearances, but he drops to 25 HR, 90 R, 90 RBI, and 20 SB.

To summarize our two scenarios:

WAP2

How Likely Are These Scenarios To Occur?

You might have your own beliefs about the likelihood of each, but for the sake of example let’s say we think Braun is 90% likely to have another year in line with his past five seasons and 10% likely to experience a year where the effect of no PEDs drags his performance down some.

WAP3

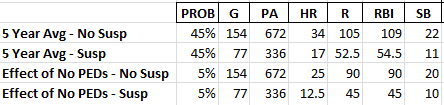
And What If He Gets Suspended?

Again, for the sake of illustrating a simple example, assume a 50% chance Braun does not get suspended during the year and a 50% chance Braun misses half the season.

These 50-50 alternatives are subsets of our previous two scenarios.  So the 90% chance Braun has another average year now becomes a 45% chance (90% * 50%) he has a career average year and does not get suspended and a 45% chance he has a career average year and does get suspended.

Likewise, the 10% chance he sees a drop in productivity due to coming off PEDs is split into a 5% bucket of not being suspended and a 5% bucket of being suspended.

Regardless of the scenarios we lay out, we must remain at 100% total probability for all the possible outcomes.  Something has to happen.  And with 45, 45, 5, and 5, we’re still at 100%.

WAP4

Weighted Average Probability, Expected Results

Once you have probabilities for each possible outcome, it’s easy to calculate the total expected result.  We simply multiply the expected statistics for each scenario by the likelihood of that scenario.  This is the “weighting”.

Look at the 5 Year Avg – No Suspension example.  We have determined this scenario has a 45% chance of occurring.  45% multiplied by 672 plate appearances is 302.40.  45% multiplied by 34 home runs is 15.3.  And so on.

Here are the weighted averages of all scenarios:

WAP5

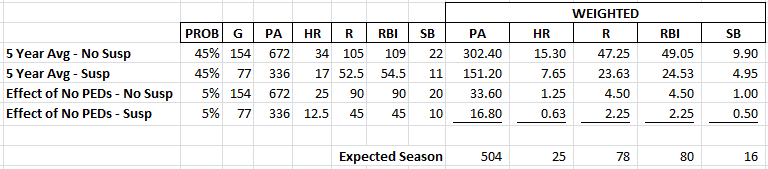
Our overall or actual expectation is the sum of each different weighted scenario.  You can see this total at the bottom of the table above.  After taking all possible scenarios and their probabilities into account, we estimated Braun for 25 HR, 78 R, 80 RBI, and 16 SB.

The Bigger Point

This approach of calculating weighted average probabilities can be used in many different scenarios.  Do you think there’s a 25% chance Troy Tulowitzki plays a full season, a 50% chance he plays 120 games, and a 25% chance he plays 80 games?  Do you think a rookie has a 25% chance of being called up in May, 25% in June, and 50% in July?  Do you think there’s a 50% chance a player will bat leadoff during the year and a 50% chance he’ll bat 9th?  Is there a 25% chance a rookie call-up will break onto the scene and be very productive, a 50% chance he’ll be an average player, and a 25% chance he’ll be sent back to the minors?

In any of these situations, calculate an estimated outcome and weight it using the probability of that outcome occurring.

Be Smart

Thanks for reading and continue to make smart choices.

Trading Strategy - Take Advantage of Misperceptions

Trading Strategy – Take Advantage of Misperceptions

What’s done is done.  April, May, June, and July are behind us and we’re heading into the stretch run.  If you’re still able to make trades in your league, here’s a strategy you can employ to squeeze a little extra out of a deal or to get a player at a discount.

Leagues are going to be decided by what happens over these last two months.  Today’s standings are based upon the past, but they will only change due to the statistics that will be earned going forward.  

So as we stand here today, we only care about the future.  This sounds obvious.  You know this.  I know this.  But many owners are unduly influenced by the past, by year-to-date statistics.  It’s impossible to avoid a player’s accumulated season-long statistics.  Visit player X’s profile page online or watch their game on TV and you’re bombarded with graphics showing they have 23 HR, 72 RBI, and 8 SB.  

There’s an opportunity here.

PAST PERFORMANCE IS NOT INDICATIVE OF FUTURE RESULTS

That player with 23 HR, 72 RBI, and 8 SB could very easily be less productive down the stretch than a player that currently has 8 HR, 27 RBI, and 2 SB.  There are players out there that have depressed counting statistics at this point in the season.  Maybe they were injured.  Maybe they have underperformed.  Or maybe they weren’t in the Major Leagues all season.

This is an opportunity for arbitrage.  It’s about finding your own 23 HR-72 RBI guys (especially if you smell a decline coming) and swapping them for other teams’ 8 HR-27 RBI guys.

What To Look For?

If you have a tradeable commodity, a player with impressive accumulated statistics, target players that are due, or are already experiencing, increased opportunity. Additional opportunity can come in many shapes and forms.  It can come from being injured early in the season and now playing regularly.  Or being a bench player early in the year and being pushed into a starting role due to injuries.  Moving to a more valuable spot in the lineup.  Being traded to a more productive lineup.  Being called up from the minor leagues.

It is this opportunity you should be looking for.  Skills remain relatively constant.  But opportunity can change significantly in a short period of time.

On draft day, players thrust into starting roles see their value sky rocket.  They’re termed sleepers.  Everyone in the league battles for them.  When the same thing happens in mid-August, many managers won’t notice.  And if they do, they won’t react in the same rabid manner.

Give Me Names

Here are some examples of players that will have strong opportunities to play the rest of the 2013 season and have depressed counting statistics for some reason (due to injury or being called up during the year).  If you offer up player(s) that have been healthy and played all season in exchange for players like those from the list below, the perceived difference in counting statistics may allow you to earn a slight “discount”.

  • Aaron Hill
  • Brett Lawrie
  • Jason Heyward
  • Curtis Granderson
  • Giancarlo Stanton
  • Carl Crawford
  • Brad Miller
  • Bryce Harper
  • Austin Jackson
  • Nick Franklin
  • Wil Myers
  • Jonathan Villar

A Real Example

You’ll have to determine your team’s needs.  But look at the potential trade below.  To this point in the season, Leonys Martin has stolen 27 bases, good for 10th best in the major leagues.  Jonathan Villar has only been in the major leagues since July 22nd and stolen 11 already.

Granted, Villar could hit .200 and be sent back to the minors in a few weeks.  But you should easily be able to trade a Leonys Martin for a Jonathan Villar AND get something else.  Heck, you could get something significant and Villar might be a throw in.  If you’re trying to gain ground in the standings, this is the type of risk you need to take on.

AccStats1

Don’t Fall Victim

So what can you do if you’re offered a trade like this?  How can you properly evaluate the offer?

The answer is to be forward looking.  Consider completely ignoring the statistics accumulated to this point and use one of the free and reliable rest-of-season projection systems that are available.  These are updated each day and give you only the projected stats for each player going forward.

Conclusion

This won’t always work.  A skilled manager might be as disciplined and forward looking as you.  But many managers can’t help but be overly influenced by the past.  If you can combine the tactic above with other strategies to engineer a trade, you’ll be well on your way to pulling off a deal that can help you down the stretch.

Make smart choices.


Smart Elsewhere #6 – Trading Strategies from Fred Zinkie

As Major League Baseball’s trade deadline passes, it’s a good reminder to review your league standings and diagnose any weaknesses in your team that need to be addressed before the stretch run.  Once you understand where you are and where you need to go, hit the trade market.  But how do you ensure you’re making the best deal?  How do you avoid getting frustrated by the often aggravating trading process?

Expert Interviews

The Baseball HQ Radio podcast, hosted by Patrick Davitt, is my favorite resource for learning new strategies and to be exposed to different ways of thinking about fantasy baseball.  In each episode, Davitt interviews at least one industry expert.  And we’re talking respected experts like Ron Shandler (creator of Baseball HQ, among many other accomplishments), Todd Zola (creator of Mastersball.com, fantasy author all over the web), Jeff Erickson (senior editor at Rotowire, expert league winner, writer of the year), and Larry Schecter (five time TOUT Wars winner).  There is a lot to be learned from guys like this.

During the interviews, Davitt inquires about the week’s hot players and current news, but most interestingly to me, he also ask about strategies and approaches the visiting experts use.  The topics can cover things as minor as FAAB usage techniques to as more significant topics like the July 5th trading discussion between Davitt and fantasy expert Fred Zinkie.


Talking Trades

Fred is a participant in the respected TOUT and LABR rotisserie mixed leagues and he is an extremely active trader (it sounds like he’s made more than 20 trades between the two leagues).  At the time of the interview, he was also leading both of these expert leagues.

Someone able to make that many trades, in expert leagues, and use the trades to push him into first place, must have some extremely interesting insight into how to make a trade.

How To Engineer a Trade

I’ll cherry pick some of Zinkie’s recommendations on how to engineer a deal and increase your likelihood of successfully making a trade.

  1. Don’t think about your team first.  Always start with the other team in mind.  
  2. Look over the rosters of the league and identify weaknesses for each particular team.
  3. When contacting the other team, use phrasing like, “It looks like you could use this…”.   Make it about them.  
  4. Verify that they’re interested in making some kind of trade.
  5. Then move forward and identify specific players to be involved in the trade.
  6. If you receive an insulting offer or insulting counter, take a step back and approach the deal realizing there may be a fundamental difference in how they value the players involved.  Maybe they’re really asking for another player or to address another weakness.

Other Thoughts

Fred also had an interesting thought about targeting inherently flawed players, whether it be in the draft or via trade.  Players that might be elite in one category but below average in many other, players with terrible batting averages, players proven to be injury prone, players coming off of P.E.D.  suspensions.  These flawed players will have something about them that certain managers won’t touch, no matter the price.  If you’re in a 15 team league, and because of flaws, at the draft, you’re then only competing against 10 teams instead of 15 for a player, you will end up paying less.  The law of supply and demand, if you will.

Highly Recommended

I highly recommend subscribing to or regularly checking in on the Baseball HQ Radio podcasts.  You can even go back in time and just listen to the expert commentary from old episodes.  The shows are scheduled in such a way that you can easily skip forward to Davitt’s discussion with that week’s expert and then bail on the episode once they move on to discussing only current topics.

Links To The Podcast