Microsoft Excel is my go-to spreadsheet application, but what if you don’t have access to Excel? After all, it’s expensive to purchase ($100+). Are you out of luck when it comes to being a data-driven fantasy baseball player?
Hardly. There are several free options available and they’re more comparable to Excel than you might think.
Microsoft One Drive (Online Access to a Free Version of Excel)
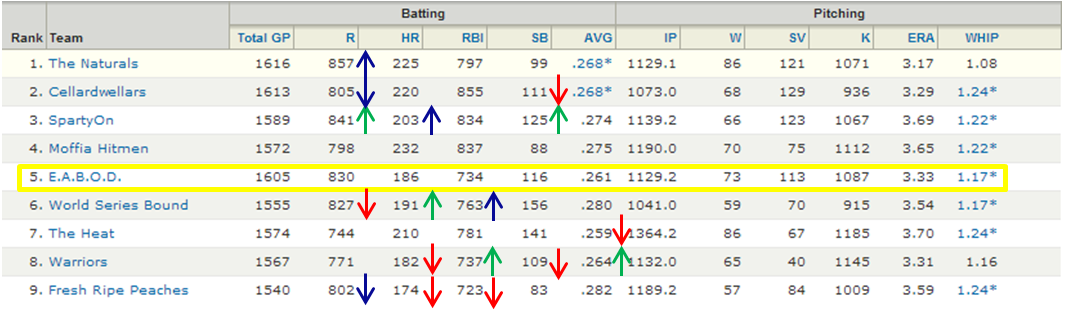
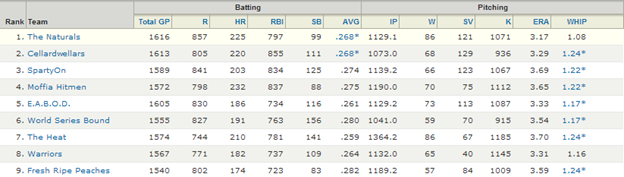
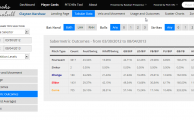
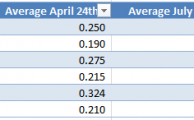
You can set up an online Microsoft OneDrive account free of charge. This gets you access to a free online version of Microsoft Excel that offers most of the capabilities available in the desktop version. You can see a screenshot of the program below.
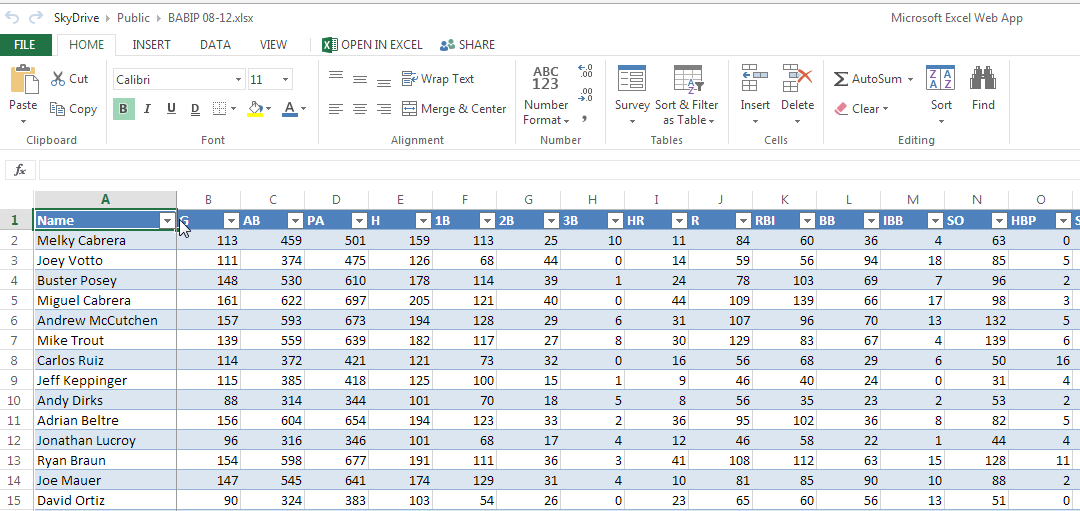
It’s definitely a viable spreadsheet application. It offers nearly all the built in functions (VLOOKUP, SUM, IF, etc.) of the traditional Microsoft Excel. It can meet the needs of any basic to moderately complex spreadsheet.
But there are several features I like to include in more advanced spreadsheets (like the sheet created in the SmartFantasyBaseball “Create Your Own Fantasy Baseball Rankings” series), that can’t be utilized in this online version of Excel. Most notably, you cannot create named cells or named ranges. Additionally, you cannot set up data validation, like drop down menus. These aren’t deal breakers, you can likely work around the absence of these items. But they’re definitely nice to have.
I’m also not aware of a way to link one Excel Sky Drive file to the data in another file saved in Sky Drive. This would be nice if you have one central Excel file that stores a lot of data and you want to be able to access it from multiple files that will rely upon that data. I don’t typically link documents together in this fashion, but it’s good to know. Online Excel files do have certain file size limitations that might make linking necessary (and you won’t be able to do it).
Google Drive (Free Online Access to Google’s Spreadsheet application)
If you have a Gmail account or if you register for a free Google account, you get access to Google Drive and free online file storage. You then get access to use Google’s free online word processor, spreadsheet, and presentation applications.
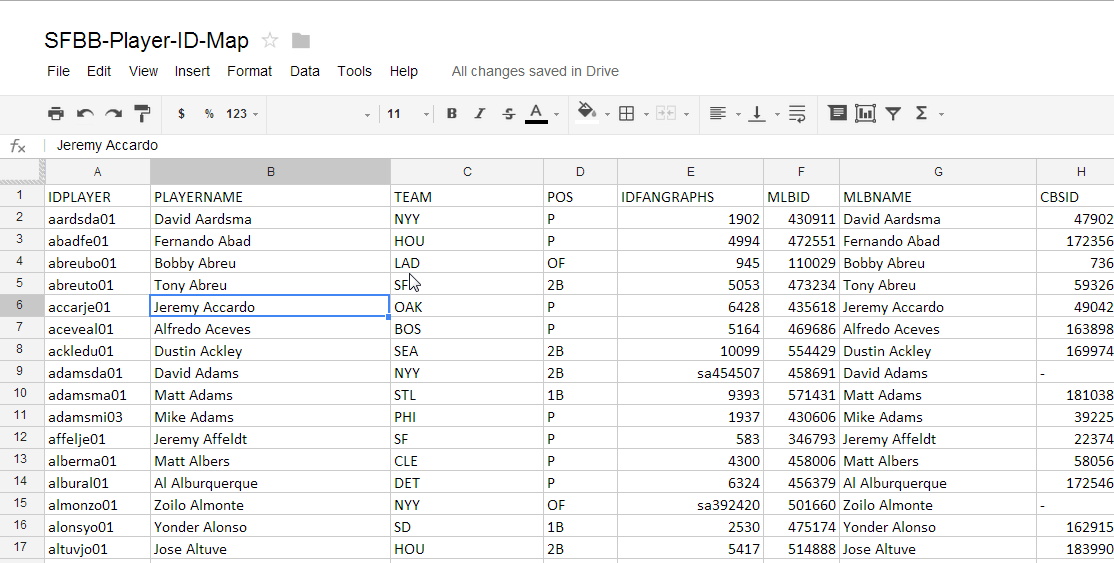
In my opinion, Google offers a more comprehensive online solution than Microsoft does. I find file management is a lot easier in Google’s interface. And within a Google Spreadsheet, you can use some of the advanced features not available in the online version of Excel. For example, you can create named ranges, link to other Google spreadsheets, and even pull in other content on the web.
I’ve created several complicated spreadsheets within Google documents using named ranges, upwards of 100 tabs, and linking to external Google Spreadsheets documents, and I’ve been very happy with the results.
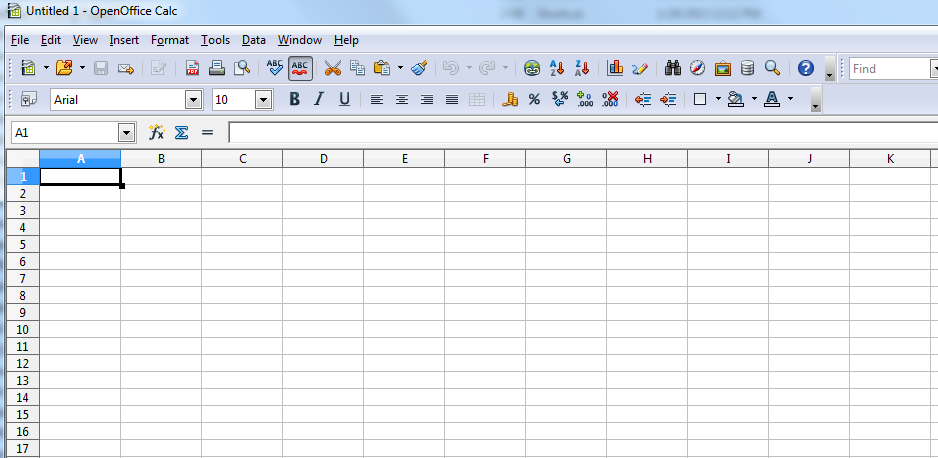
Open Office (Free Suite Of Office-Like Applications)
I do think Google’s online spreadsheet application is a strong alternative, but no online spreadsheet is going to replace the capabilities of a spreadsheet saved, accessed, and run directly from your own computer.
When working on your own computer (as opposed to a spreadsheet running over the web), the functionality is improved, calculations are processed faster, the program is more powerful, and the usability is much better. Fortunately, we have OpenOffice, which is a free alternative to Microsoft Office’s product line. OpenOffice has a spreadsheet, word processor, and presentation application, all available free of charge.
Millions of people use the OpenOffice suite and the look and feel of the programs is similar to older Microsoft Office interfaces. If you’re used to the Ribbon interface used by Microsoft Office products in the last several years, the menu systems may feel antiquated. But the program gets the job done.
OpenOffice file formats are generally interoperable with Microsoft file formats, meaning you can save OpenOffice documents and spreadsheets into Office file formats for sharing with Office users.
My Recommendation
I enjoy the more robust experience of running a spreadsheet application from the computer, as opposed to one running of the web, but I really like the experience of using Google Drive and the Google spreadsheet application. If you’ve read some of my longer posts you’ll know that I’m a fan of using named ranges, and that gives Google a big advantage of Microsoft Excel’s online web app. I also use Gmail and find the Google Drive app for my phone is very easy to use and access data from.
So I think it comes do to your own preferences and if you prefer a traditional program running on your computer or if you like the mobility, access, and backup benefits offered by a web-based application. OpenOffice is a very strong (and free!) option to run locally. And Google wins the web app battle, in my mind.
Conclusion
Don’t think you can’t implement the ideas or use the tools from SmartFantasyBaseball just because you don’t have access to Microsoft Excel. There are high quality and free alternatives available to you.
Be smart.